Probability Density Function
Download script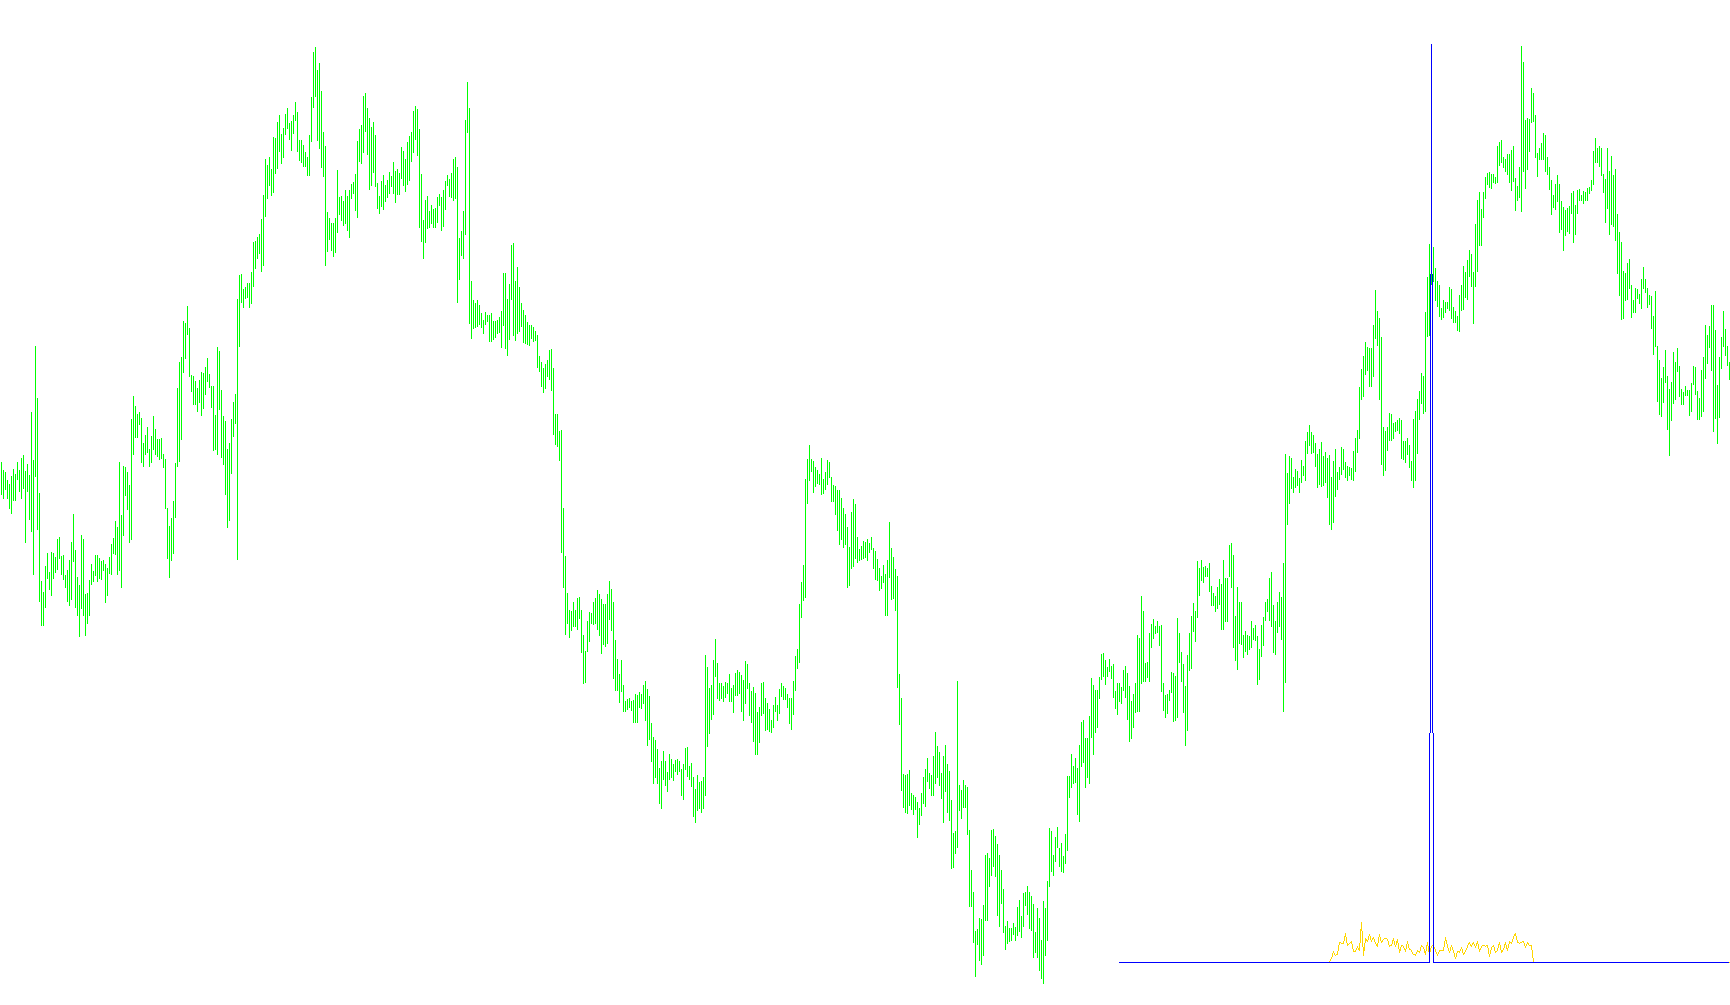
This script is designed as a specialized visual analysis tool for traders to better understand market sentiment and momentum. Rather than simply showing the current price action, it processes historical data to create a statistical distribution of where the market "prefers" to spend its time.
How the Logic Works
The core objective of this tool is to convert standard momentum data into a probability map. Here is a breakdown of the process:
1. Data Collection and Movement Analysis The script looks backward at a specific number of historical candles (defined by the user). For every candle in that period, it calculates a Stochastic value. This helps the tool identify whether the market was overbought, oversold, or moving neutrally at any given moment in the past.
2. Mathematical Transformation The script doesn't just look at the raw numbers; it performs several mathematical adjustments to the data:
- Normalization: It scales the momentum values to ensure they fit within a specific range.
- Logarithmic Scaling: It applies a logarithmic formula to the data. This is often used in finance to linearize exponential relationships, making the distribution of data points more accurate for analysis.
- Centering: It shifts the resulting values so that they are centered around a median point, allowing for a balanced "left and right" view of the market's behavior.
3. Frequency Counting (The Distribution) Imagine taking every historical price point and placing them into bins or "buckets." The script counts how many times the market landed in each specific bucket.
- It tracks two different types of distributions simultaneously: one based on the standard movement and one based on the transformed (logarithmic) movement.
4. Visualizing the Results Finally, the script plots these counts as lines on a separate window in your trading platform.
- The primary line shows you the raw frequency of occurrences.
- The secondary line provides a modified view of that frequency with a capped threshold to highlight specific significant densities.
Summary for Traders
Instead of telling you what the price will do next, this tool tells you how the market has behaved in the past. By looking at the resulting curves, a trader can identify "zones" where the market has historically clustered most frequently. It allows you to see the "shape" of the market's momentum, helping you identify high-probability areas where the price tends to settle or react based on historical frequency.
//+------------------------------------------------------------------+
//|                                                          PDF.mq4 |
//|                         Copyright © 2006, Luis Guilherme Damiani |
//|                                      http://www.damianifx.com.br |
//+------------------------------------------------------------------+
#property copyright "Copyright © 2006, Luis Guilherme Damiani"
#property link      "http://www.damianifx.com.br"

#property indicator_separate_window
#property indicator_buffers 2
#property indicator_color1 MediumSeaGreen
#property indicator_color2 Yellow

double pdf[];
double pdft[];
//---- input parameters
extern int       ch_size=20;
extern int       cn=300;
//extern int limit_value=0;
//+------------------------------------------------------------------+
//| Custom indicator initialization function                         |
//+------------------------------------------------------------------+
int init()
  {

  SetIndexStyle(0,DRAW_LINE);
   SetIndexBuffer(0,pdf);
   SetIndexStyle(1,DRAW_LINE);
   SetIndexBuffer(1,pdft);

//----
   return(0);
  }
//+------------------------------------------------------------------+
//| Custom indicator deinitialization function                       |
//+------------------------------------------------------------------+
int deinit()
  {
//----

//----
   return(0);
  }
//+------------------------------------------------------------------+
//| Custom indicator iteration function                              |
//+------------------------------------------------------------------+
int start()
  {

//----
//---- indicators
   int counter[];
   int counter_ft[];
   int totBars=Bars;
   int value,ftvalue=0;

   int    counted_bars=IndicatorCounted();

   if(counted_bars<0) return(-1);
   ArrayResize(counter,cn+1);
   ArrayResize(counter_ft,cn+1);
   ArrayInitialize(counter,0);
   ArrayInitialize(counter_ft,0);
   for(int i =Bars-1-ch_size;i>=0;i--)
   {
      value=MathCeil(iStochastic(NULL,0,ch_size, 2,1,MODE_SMA,0,MODE_MAIN,i));

      ftvalue=(value/100-0.5)*2;
      if(ftvalue<-0.9999)ftvalue=-0.9999;
      if(ftvalue>0.9999)ftvalue=0.9999;
      ftvalue=0.5*MathLog((1+ftvalue)/(1-ftvalue));
      ftvalue=MathCeil((ftvalue/2+0.5)*100)+(MathFloor(cn/2)-50);
      if(ftvalue>cn)ftvalue=cn;
      if(ftvalue<0)ftvalue=0;

      value=value+(MathFloor(cn/2)-50);
      counter[cn-value]=counter[cn-value]+1;
      counter_ft[cn-ftvalue]=counter_ft[cn-ftvalue]+1;
   }
   pdf[0]=0;
   for(i=cn;i>0;i--)
   {
      pdf[i]=counter[i];
      if(counter_ft[i]<700)pdft[i]=counter_ft[i];
      else pdft[i]=700;
     // Print(pdf[i]);
   }
//----
   return(0);
  }
//+------------------------------------------------------------------+
Comments