prusax_v8
Download script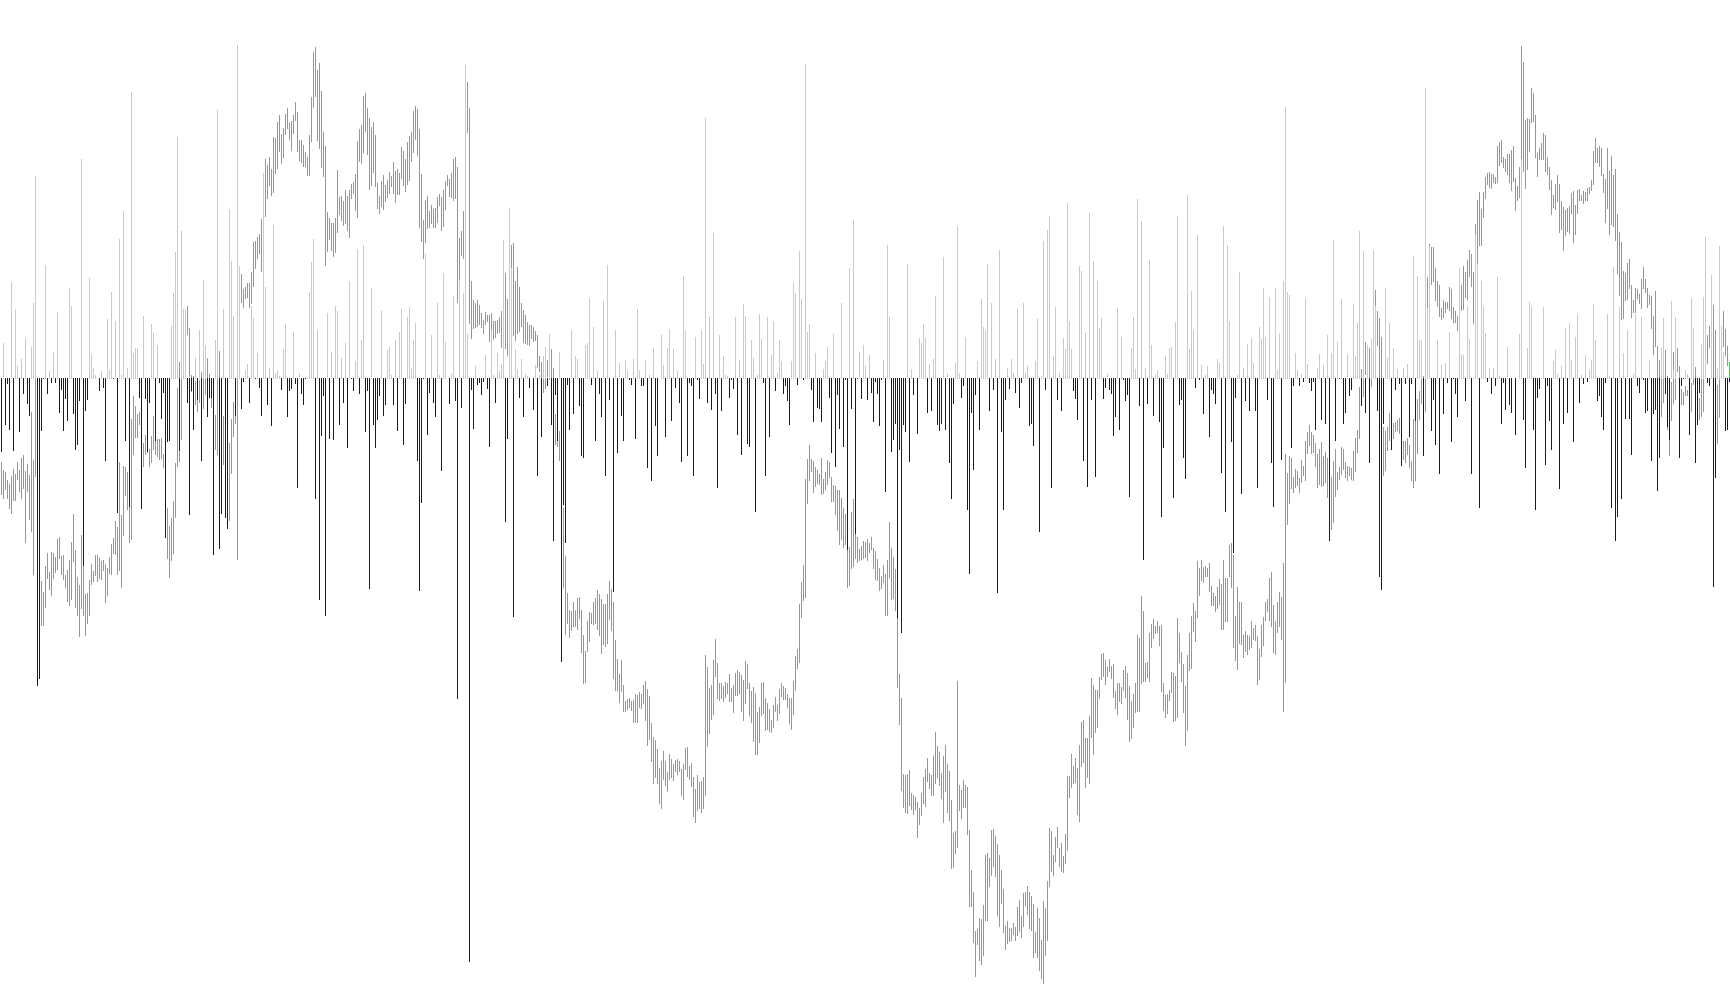
This tool functions as a visual momentum tracker designed to help traders identify the prevailing strength of price movement during specific time periods. Instead of looking at just the final price, it analyzes the relationship between the highest and lowest points of a candle compared to where the price actually opened and closed.
How the Logic Works
The script evaluates every individual candle on your chart by calculating two distinct values:
- Upward Pressure: This is determined by measuring how much the price pushed toward the top of the range relative to its starting point, combined with how close it stayed to the top at the end.
- Downward Pressure: This is determined by measuring how much the price pushed toward the bottom of the range relative to its starting point, combined with how close it stayed to the bottom at the end.
Visual Representation
The indicator then compares these two values to decide which direction is "winning" for that specific candle:
- Bullish Dominance: If the upward pressure is stronger than the downward pressure, the script creates a visual upward signal (represented as a white histogram). It calculates the difference between the two pressures to determine the size of the bar.
- Bearish Dominance: If the downward pressure is stronger, the script creates a visual downward signal (represented as a red histogram). Again, it calculates the difference to set the height of the bar.
- Neutrality: If the values are equal or insignificant, the indicator remains neutral, ensuring that only clear shifts in momentum are highlighted.
Practical Purpose
By converting these raw price movements into a separate histogram window, the tool allows you to see the "intensity" of the market's direction at a glance. It helps filter out minor noise by highlighting candles where there is a clear consensus between the price action and the high/low boundaries, making it easier to identify trends and potential shifts in sentiment.
//+------------------------------------------------------------------+
//| prusax_v8.mq4
//|
//+------------------------------------------------------------------+

#property indicator_separate_window
#property indicator_buffers 2
#property indicator_color1 White
#property indicator_color2 Red
#property indicator_width1 3
#property indicator_width2 3


//---- buffers
double BufferUP[];
double BufferDN[];

//+------------------------------------------------------------------+
//| Custom indicator initialization function |
//+------------------------------------------------------------------+
int init()
{
string short_name;
//---- indicator line
IndicatorBuffers(2);
SetIndexStyle(0,DRAW_HISTOGRAM);
SetIndexBuffer(0,BufferUP);
SetIndexStyle(1,DRAW_HISTOGRAM);
SetIndexBuffer(1,BufferDN);
SetIndexDrawBegin(0,10);
SetIndexDrawBegin(1,10);
//----
return(0);
}
//+------------------------------------------------------------------+
//|
//+------------------------------------------------------------------+
int start()
{
int i,counted_bars=IndicatorCounted();

double UP,DN;
//----


for(i=Bars-counted_bars-1;i>=0;i--)

{
UP = ((High[i]-Open[i])+(Close[i]-Low[i]));
DN = ((Open[i]-Low[i])+(High[i]-Close[i]));

if (UP > DN) {
BufferUP[i] = UP-DN;
BufferDN[i] = 0.0;
}

if (UP < DN) {
BufferUP[i] = 0.0;
BufferDN[i] = -1*(DN-UP);
}

}


return(0);
}
//+------------------------------------------------------------------+
Comments