proba demark
Download script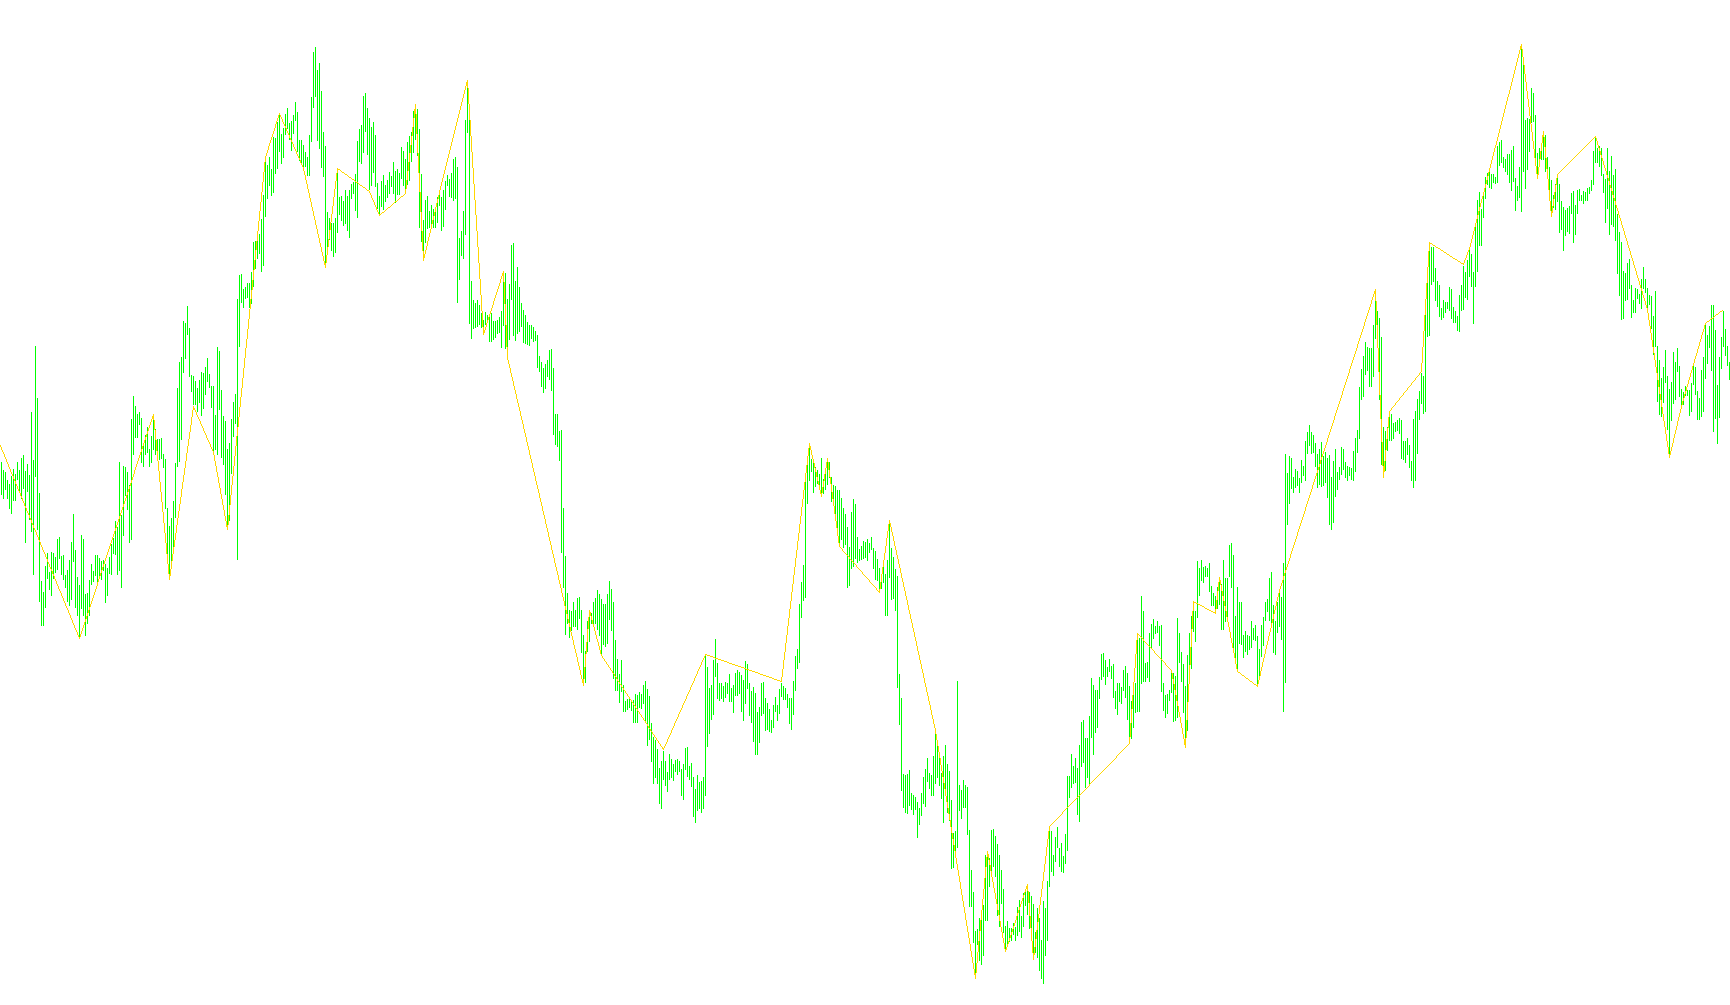
This tool is designed to act as a visual trend indicator for your trading charts, specifically identifying significant structural shifts in price action over a large historical period. Instead of reacting to minor fluctuations, the logic focuses on identifying distinct "V" and "inverted V" patterns that suggest a change in momentum.
How the Logic Works
The script scans through a deep history of market data (up to 1,000 bars) to look for specific geometric price formations. It evaluates the relationship between four consecutive price candles to determine if the market has reached a definitive turning point.
1. Identifying Bullish Reversals (Bottoms) The script looks for a "V" shape in the price movement. Specifically, it checks if:
- The closing prices of three recent candles are higher than the preceding candle's close.
- The lowest points (lows) of those same candles also show a consistent upward trend compared to the previous lows.
When the script detects this specific upward "hook," it marks the bottom of that move on your chart with a blue line. This helps traders visualize where a potential floor was established in the price action.
2. Identifying Bearish Reversals (Tops) Conversely, the script looks for an "inverted V" shape to identify downward pressure. It checks if:
- The closing prices of three recent candles are lower than the preceding candle's close.
- The highest points (highs) of those candles are also consistently dropping compared to previous highs.
When this downward trend is confirmed, the script marks the peak of that move on your chart.
Visual Representation
Rather than just showing a single point, the tool draws these significant price levels as a connected section on your chart. By marking the "highs" and "lows" where the data confirms a change in direction, it provides a visual roadmap of the market's structural history, allowing you to see the primary peaks and valleys more clearly without the clutter of every minor price movement.
//+------------------------------------------------------------------+
//+                                                                  +
//+------------------------------------------------------------------+
#property indicator_chart_window
#property indicator_buffers 1
#property indicator_color1 Blue

extern int DeepBars=1000;
//---- buffers
double ExtMapBuffer1[];
//+------------------------------------------------------------------+
//| Custom indicator initialization function                         |
//+------------------------------------------------------------------+
int init()
  {
   IndicatorShortName("Demark");
//---- indicators
//   SetIndexStyle(0,DRAW_ARROW);
   SetIndexStyle(0,DRAW_SECTION);
   SetIndexBuffer(0,ExtMapBuffer1);
   SetIndexEmptyValue(0,0.0);
//----
   return(0);
  }
//+------------------------------------------------------------------+
//| Accumulation/Distribution                                        |
//+------------------------------------------------------------------+
int start()
  {
   int i;
//----
   i=DeepBars;
   for(i=1;i<=DeepBars;i++)
    {
     if (((iClose(Symbol(),0,i)>iClose(Symbol(),0,i+1)) && (iClose(Symbol(),0,i+2)>iClose(Symbol(),0,i+1)) && (iClose(Symbol(),0,i+3)>iClose(Symbol(),0,i+2))) &&
        ((iLow(Symbol(),0,i)>iLow(Symbol(),0,i+1)) && (iLow(Symbol(),0,i+2)>iLow(Symbol(),0,i+1)) && (iLow(Symbol(),0,i+3)>iLow(Symbol(),0,i+2))))
      {
       ExtMapBuffer1[i+1]=iLow(Symbol(),0,i+1)-5*Point;
      }
      if (((iClose(Symbol(),0,i)<iClose(Symbol(),0,i+1)) && (iClose(Symbol(),0,i+2)<iClose(Symbol(),0,i+1)) && (iClose(Symbol(),0,i+3)<iClose(Symbol(),0,i+2))) &&
        ((iHigh(Symbol(),0,i)<iHigh(Symbol(),0,i+1)) && (iHigh(Symbol(),0,i+2)<iHigh(Symbol(),0,i+1)) && (iHigh(Symbol(),0,i+3)<iHigh(Symbol(),0,i+2))))
      {
       ExtMapBuffer1[i+1]=iHigh(Symbol(),0,i+1)+5*Point;
      }
    }
//----
   return(0);
  }
//+------------------------------------------------------------------+
Comments