price_O-Cl
Download script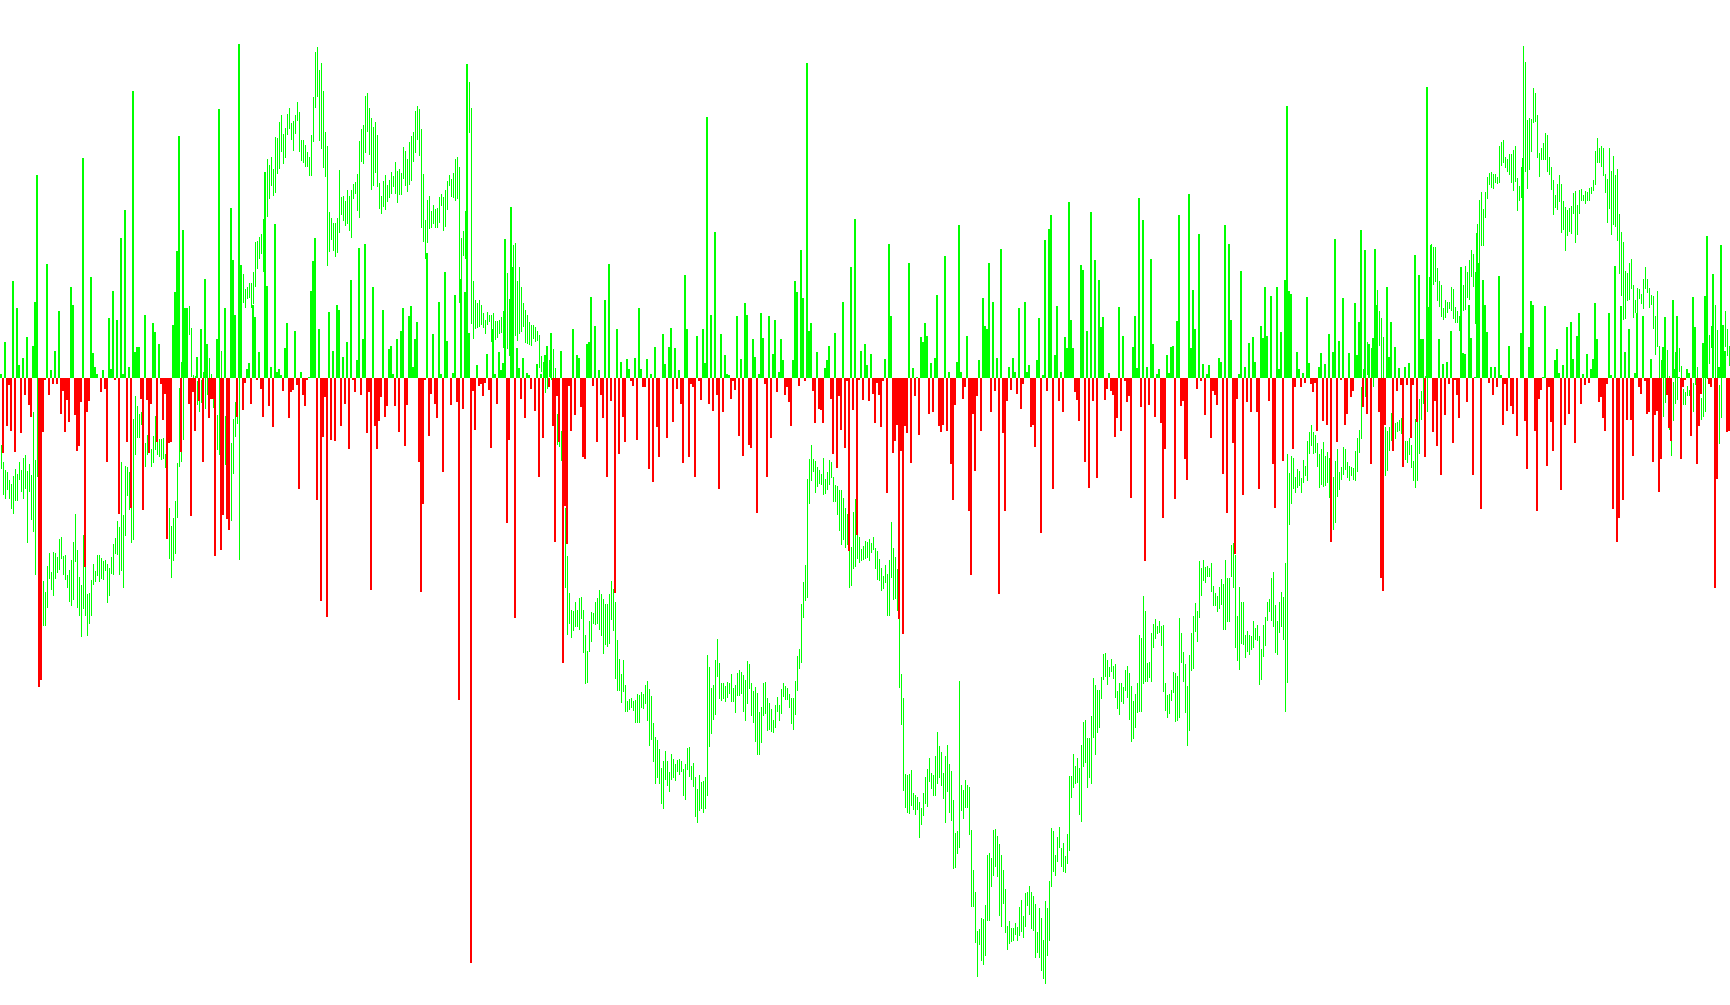
This tool is designed to provide a visual representation of price movement by analyzing the relationship between the opening and closing prices of individual candles on your trading chart. Instead of showing you the price itself, it isolates the "body" of each candle to highlight the direction and magnitude of the market's momentum over a specific period.
How the Logic Works
The script performs a systematic review of the most recent price bars (up to 1,000 by default) and applies the following logic to each one:
- Price Difference Calculation: The tool looks at the difference between where a candle started (the Open) and where it finished (the Close). It converts this movement into a numerical value based on the smallest price increments of the specific currency or asset you are trading.
- Directional Classification: Once it determines the size of the move, it categorizes the candle into one of two types:
- Bullish Movement: If the closing price is higher than the opening price, the movement is recorded as a positive value. This is represented visually on your chart in Lime.
- Bearish Movement: If the closing price is lower than the opening price, the movement is recorded as a negative value. This is represented visually on your chart in Red.
- Visual Representation: Rather than appearing as a simple line, the results are displayed as a histogram in a separate window below your main chart. This allows you to see the "pulse" of the market clearly—where tall bars indicate high volatility or strong price action, and small bars indicate consolidation or indecision.
Summary for the User
Essentially, this script acts as a visual filter that strips away all other market noise, leaving you with a clean histogram of price displacement. It allows you to quickly identify whether the market is trending strongly in one direction or if it is experiencing significant fluctuations between the start and end of each period.
//+------------------------------------------------------------------+
//|                                                          003.mq4 |
//|                                                     Yuriy Tokman |
//|                                            yuriytokman@gmail.com |
//+------------------------------------------------------------------+
#property copyright "Yuriy Tokman"
#property link      "yuriytokman@gmail.com"

#property indicator_separate_window
#property indicator_buffers 2
#property indicator_color1 Lime
#property indicator_color2 Red

double buffer1[];
double buffer2[];
extern int       barsToProcess=1000;
//+------------------------------------------------------------------+
//| Custom indicator initialization function                         |
//+------------------------------------------------------------------+
int init()
  {
//---- indicators
SetIndexStyle(0,DRAW_HISTOGRAM,STYLE_SOLID,2,Lime);
  SetIndexBuffer(0,buffer1);
  SetIndexStyle(1,DRAW_HISTOGRAM,STYLE_SOLID,2,Red);
  SetIndexBuffer(1,buffer2);
//----
   return(0);
  }
//+------------------------------------------------------------------+
//| Custom indicator deinitialization function                       |
//+------------------------------------------------------------------+
int deinit()
  {
//----

//----
   return(0);
  }
//+------------------------------------------------------------------+
//| Custom indicator iteration function                              |
//+------------------------------------------------------------------+
int start()
  {
   int    counted_bars=IndicatorCounted(),
//----
 limit;
   int i=0;
   if(counted_bars>0)
      counted_bars--;

   limit=Bars-counted_bars;

   if(limit>barsToProcess)
      limit=barsToProcess;

   while (i<limit)
   {

   double k=(Close[i]-Open[i])/Point;
   if (k>0)
    buffer1[i]= k;
   if (k<0)
    buffer2[i]= k;
   i++;
   }
//----
   return(0);
  }
//+------------------------------------------------------------------+
Comments