prusax_v6
Download script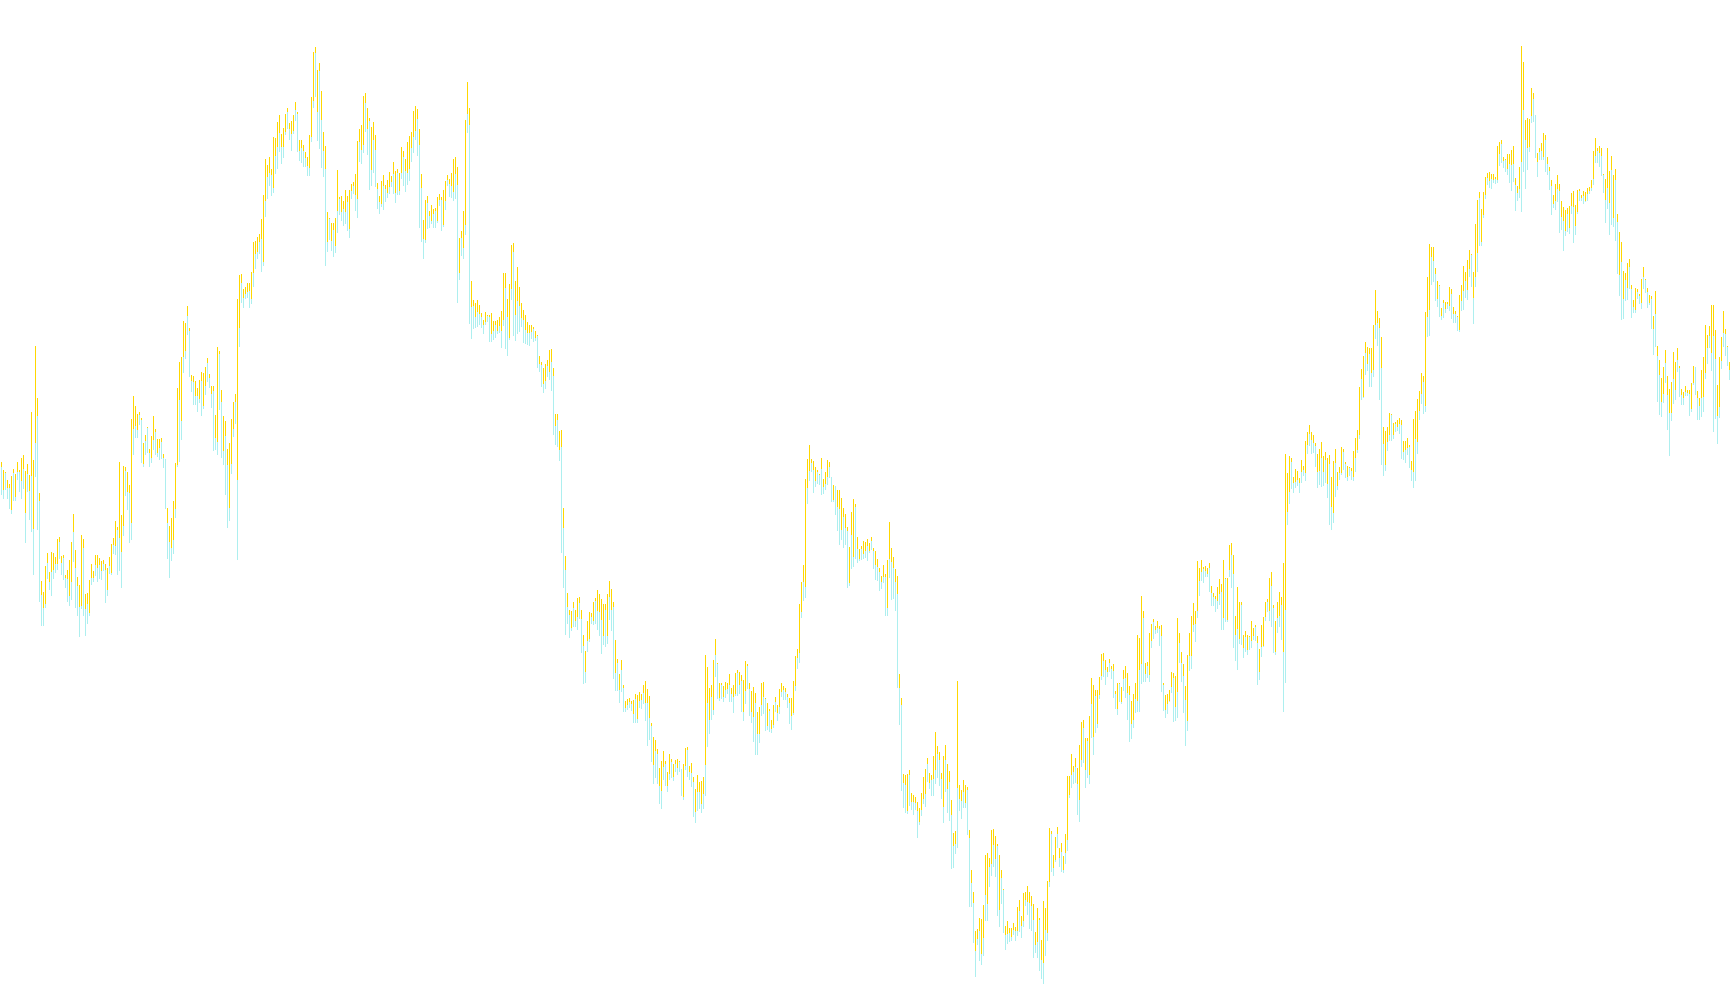
This tool is designed to provide a visual representation of price action dynamics directly on your trading chart. It works by analyzing the relationship between various price points—specifically the High, Low, Open, and Close prices—of each individual candle to calculate specific geometric coordinates.
Core Logic Overview
The indicator processes historical data to identify four distinct visual components represented as histograms. Instead of simply following the closing price, the logic focuses on the "body" and "range" of the candles to determine where the price tension lies.
How the Calculations Work
The script performs a series of mathematical offsets to plot these visual markers:
- Primary Upper Bound: This identifies the absolute peak of the current candle's movement.
- Adjusted Upper Point: The logic calculates the midpoint of the candle's "extremes" (the distance between the High/Open and Close/Low). By subtracting this average from the high, it creates a shifted reference point that reflects how much "room" is left in the upper range.
- Core Reference Point: This utilizes the same calculation as the adjusted upper point, serving to create a mirrored visual balance against the primary upper bound.
- Dynamic Lower Target: This is the most complex calculation in the script. It takes the previous reference point and further subtracts the average of the remaining price gaps (the distance from the Open to the Low and the High to the Close). This identifies a deeper, more nuanced coordinate within the candle's range.
Visual Interpretation
By calculating these four distinct levels for every candle on your chart, the tool provides a consistent visual map of market volatility. It translates raw price data into a structured set of coordinates, allowing you to see how different types of price action (long wicks, full bodies, or gaps) shift the mathematical balance of the market in real-time.
//+------------------------------------------------------------------+
//| prusax_v2.mq4
//|
//+------------------------------------------------------------------+

#property indicator_chart_window
#property indicator_buffers 4
#property indicator_color1 White
#property indicator_color2 White
#property indicator_color3 Red
#property indicator_color4 Red
#property indicator_width1 3
#property indicator_width2 3
#property indicator_width3 3
#property indicator_width4 3

//---- buffers
double BufferUP[];
double BufferDN[];
double BufferUP1[];
double BufferDN1[];

//+------------------------------------------------------------------+
//| Custom indicator initialization function |
//+------------------------------------------------------------------+
int init()
{
string short_name;
//---- indicator line
IndicatorBuffers(4);
SetIndexStyle(0,DRAW_HISTOGRAM);
SetIndexBuffer(0,BufferUP);
SetIndexStyle(1,DRAW_HISTOGRAM);
SetIndexBuffer(1,BufferUP1);
SetIndexStyle(2,DRAW_HISTOGRAM);
SetIndexBuffer(2,BufferDN);
SetIndexStyle(3,DRAW_HISTOGRAM);
SetIndexBuffer(3,BufferDN1);
SetIndexDrawBegin(0,10);
SetIndexDrawBegin(1,10);
SetIndexDrawBegin(2,10);
SetIndexDrawBegin(3,10);
//----
return(0);
}
//+------------------------------------------------------------------+
//|
//+------------------------------------------------------------------+
int start()
{
int i,counted_bars=IndicatorCounted();

for(i=Bars-counted_bars-1;i>=0;i--)

{
BufferUP[i]    = High[i];
BufferUP1[i]   = (High[i]-(((High[i]-Open[i])+(Close[i]-Low[i]))/2));
BufferDN[i]    = (High[i]-(((High[i]-Open[i])+(Close[i]-Low[i]))/2));
BufferDN1[i]   = (High[i]-(((High[i]-Open[i])+(Close[i]-Low[i]))/2))-(((Open[i]-Low[i])+(High[i]-Close[i]))/2);
}


return(0);
}
//+------------------------------------------------------------------+
Comments