price_prevCl-O
Download script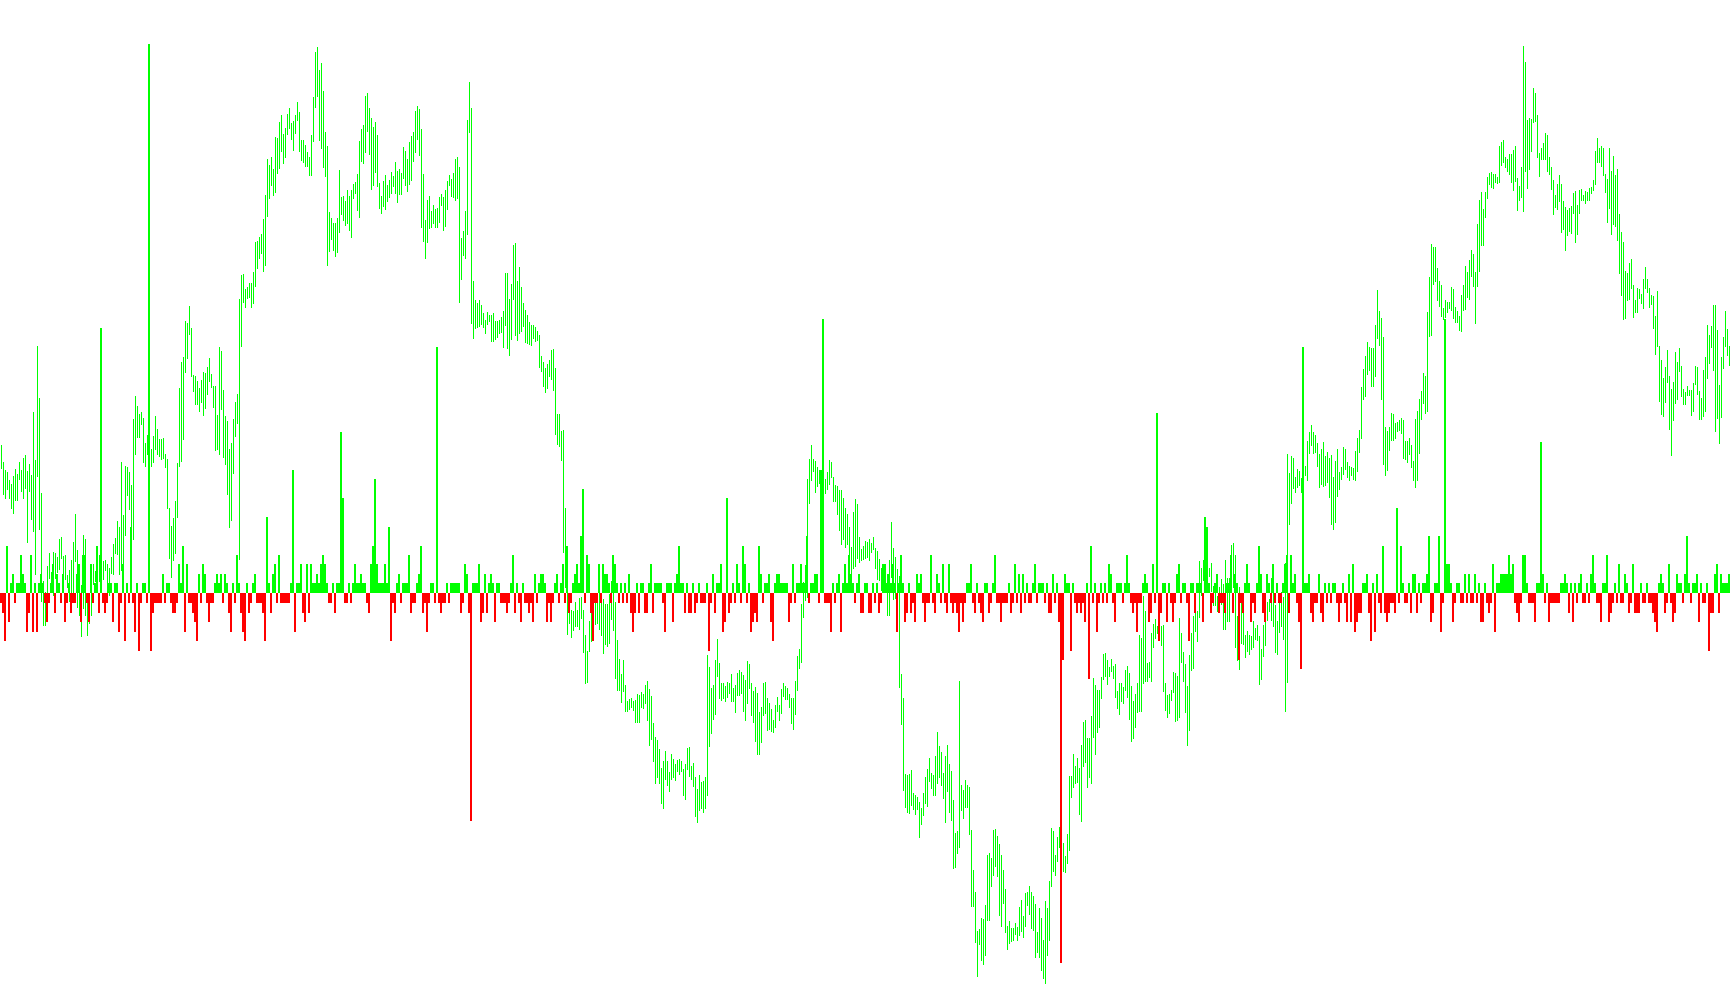
This tool is designed as a visual aid for traders using the MetaTrader platform to identify specific price movements over a defined period of historical data. Rather than cluttering your main chart with complex lines, it creates a separate visual window at the bottom of your screen, displaying activity in the form of a histogram.
Core Functionality
The script analyzes the relationship between two consecutive candles (the current bar and the one immediately preceding it) to determine the "momentum" or the specific distance moved by the price.
Specifically, it looks at:
- The Opening Price of the current candle.
- The Closing Price of the previous candle.
By calculating the difference between these two points, the script determines whether the price has jumped forward or backward.
Visual Representation
The logic categorizes these movements into two distinct types, which are displayed in different colors to make them easy to read at a glance:
- Lime Histograms: These appear when the opening price of the current candle is higher than the closing price of the previous candle. This represents an upward movement or a "gap up" in value.
- Red Histograms: These appear when the opening price of the current candle is lower than the closing price of the previous candle. This represents a downward movement or a "gap down" in value.
Key Settings and Performance
To ensure the platform runs smoothly, the script includes a processing limit. Instead of calculating every single historical data point since the beginning of time—which could slow down your computer—it focuses on a specific number of recent bars (defaulted to 1,000). This allows for a high-speed visual summary of recent market action without compromising the responsiveness of your trading terminal.
//+------------------------------------------------------------------+
//|                                                          003.mq4 |
//|                                                     Yuriy Tokman |
//|                                            yuriytokman@gmail.com |
//+------------------------------------------------------------------+
#property copyright "Yuriy Tokman"
#property link      "yuriytokman@gmail.com"

#property indicator_separate_window
#property indicator_buffers 2
#property indicator_color1 Lime
#property indicator_color2 Red

double buffer1[];
double buffer2[];
extern int       barsToProcess=1000;
//+------------------------------------------------------------------+
//| Custom indicator initialization function                         |
//+------------------------------------------------------------------+
int init()
  {
//---- indicators
SetIndexStyle(0,DRAW_HISTOGRAM,STYLE_SOLID,2,Lime);
  SetIndexBuffer(0,buffer1);
  SetIndexStyle(1,DRAW_HISTOGRAM,STYLE_SOLID,2,Red);
  SetIndexBuffer(1,buffer2);
//----
   return(0);
  }
//+------------------------------------------------------------------+
//| Custom indicator deinitialization function                       |
//+------------------------------------------------------------------+
int deinit()
  {
//----

//----
   return(0);
  }
//+------------------------------------------------------------------+
//| Custom indicator iteration function                              |
//+------------------------------------------------------------------+
int start()
  {
   int    counted_bars=IndicatorCounted(),
//----
 limit;
   int i=0;
   if(counted_bars>0)
      counted_bars--;

   limit=Bars-counted_bars;

   if(limit>barsToProcess)
      limit=barsToProcess;

   while (i<limit)
   {

   double k=(Open[i]-Close[i+1])/Point;
   if (k>0)
    buffer1[i]= k;
   if (k<0)
    buffer2[i]= k;
   i++;
   }
//----
   return(0);
  }
//+------------------------------------------------------------------+
Comments