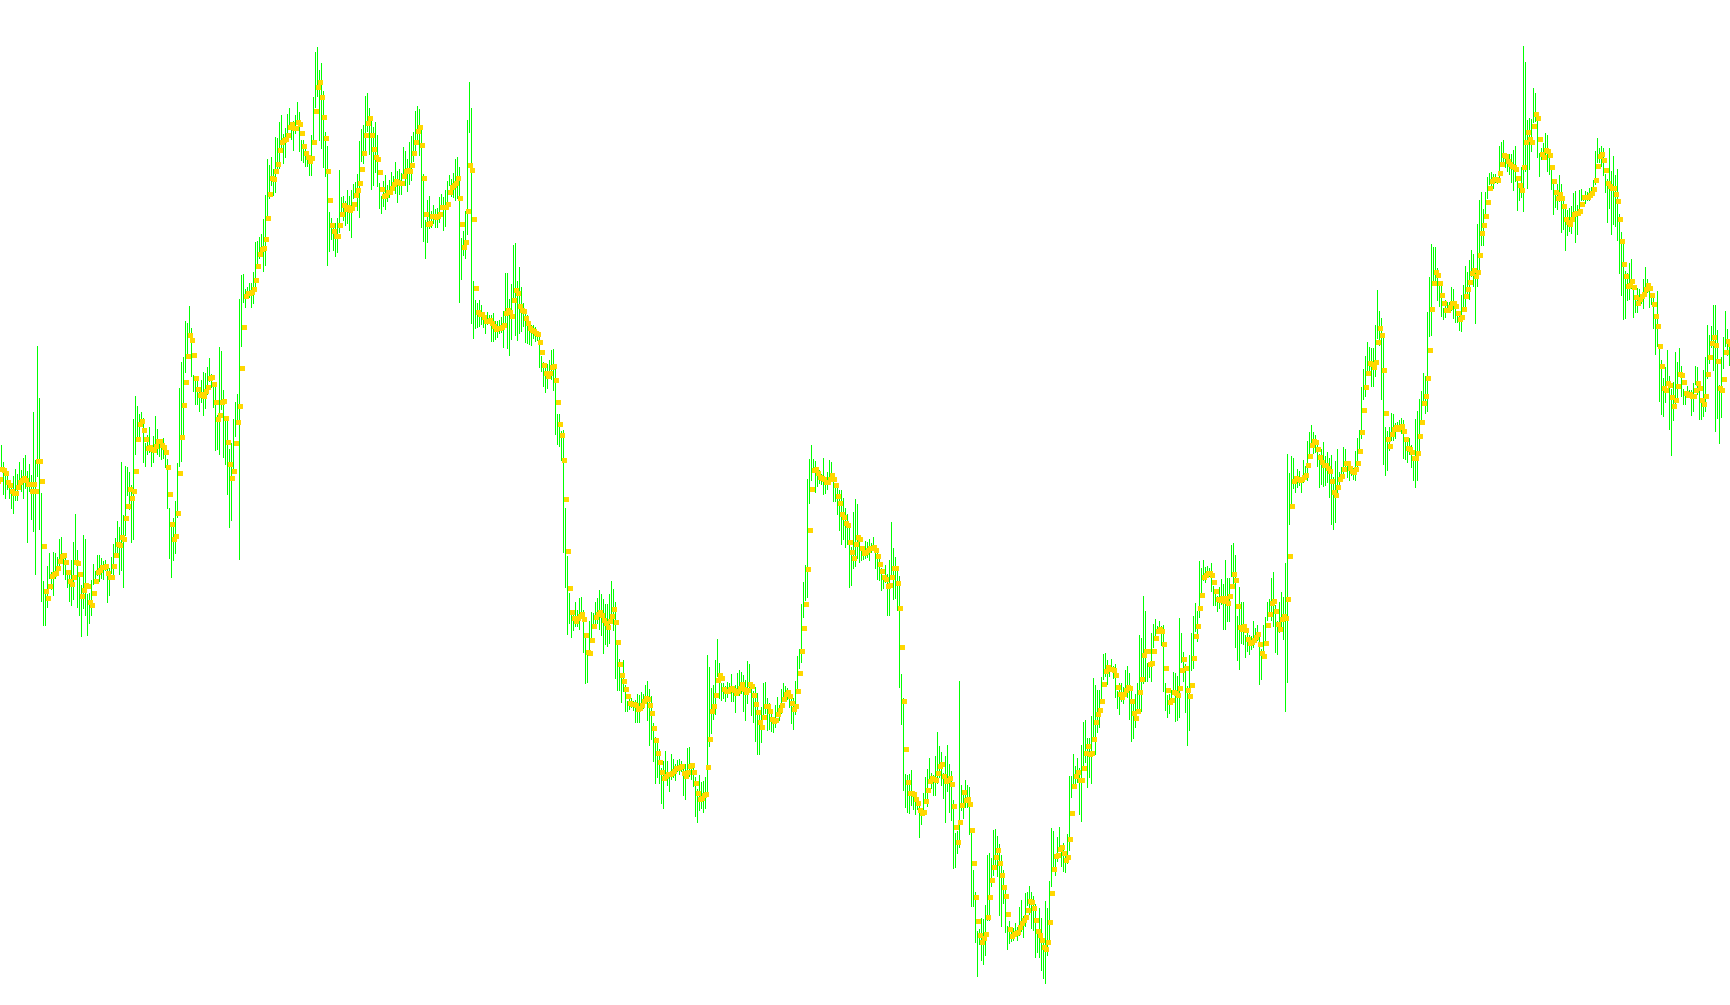
This tool is designed as a visual aid for traders using the MetaTrader platform to identify specific price trends and patterns on a financial chart. Rather than showing a continuous line, it places distinct red markers on your screen to highlight significant data points based on historical price movements.
How the Logic Works
The script analyzes the "anatomy" of each candle (the individual bars on your chart) by looking at three primary price points: the High (the highest price reached), the Low (the lowest price reached), and the Close (the final price at which the period ended).
To determine where to place its markers, the logic follows a specific mathematical sequence:
- Individual Price Calculation: For every individual candle on the chart, the tool calculates an average value by combining the High, Low, and Close prices.
- Three-Period Averaging: The script does not look at just one candle in isolation. Instead, it takes these calculated averages from three consecutive candles (the current one, the one immediately before it, and the one before that).
- Final Smoothing: It then calculates the average of those three values to find a single central point.
The Result on Your Chart
By performing this "averaging of averages," the tool filters out minor market "noise" or sudden, insignificant spikes. The resulting red arrows represent a smoothed price point that accounts for the movement over a three-candle window.
This allows you to see a stabilized view of where the price has been gravitating, helping you visualize price momentum more clearly than by looking at raw price action alone.
//+------------------------------------------------------------------+
//|                                                        PLdot.mq4 |
//|                                      Copyright © 2006, Eli hayun |
//|                                          http://www.elihayun.com |
//+------------------------------------------------------------------+
#property copyright "Copyright © 2006, Eli hayun"
#property link      "http://www.elihayun.com"
//----
#property indicator_chart_window
#property indicator_buffers 1
#property indicator_color1 Red
//---- buffers
double ExtMapBuffer1[];
//+------------------------------------------------------------------+
//| Custom indicator initialization function                         |
//+------------------------------------------------------------------+
int init()
  {
//---- indicators
   SetIndexStyle(0,DRAW_ARROW);
   SetIndexArrow(0,167);
   SetIndexBuffer(0,ExtMapBuffer1);
   SetIndexEmptyValue(0,0.0);
//----
   return(0);
  }
//+------------------------------------------------------------------+
//| Custom indicator deinitialization function                       |
//+------------------------------------------------------------------+
int deinit()
  {
//----
//----
   return(0);
  }
//+------------------------------------------------------------------+
//| Custom indicator iteration function                              |
//+------------------------------------------------------------------+
int start()
  {
   int    counted_bars=IndicatorCounted();
   if(counted_bars<0) return(-1);
//---- last counted bar will be recounted
   if(counted_bars>0) counted_bars--;
   int limit=Bars-counted_bars;
     for(int i=1; i<=limit; i++)
     {
      ExtMapBuffer1[i-1]=(
         ((High[i+1] + Low[i+1]+Close[i+1])/3) +
         ((High[i+2] + Low[i+2]+Close[i+2])/3) +
         ((High[i] + Low[i]+Close[i])/3)
      )/3;
     }
   //----
   return(0);
  }
//+------------------------------------------------------------------+
Comments