Predict_v2
Download script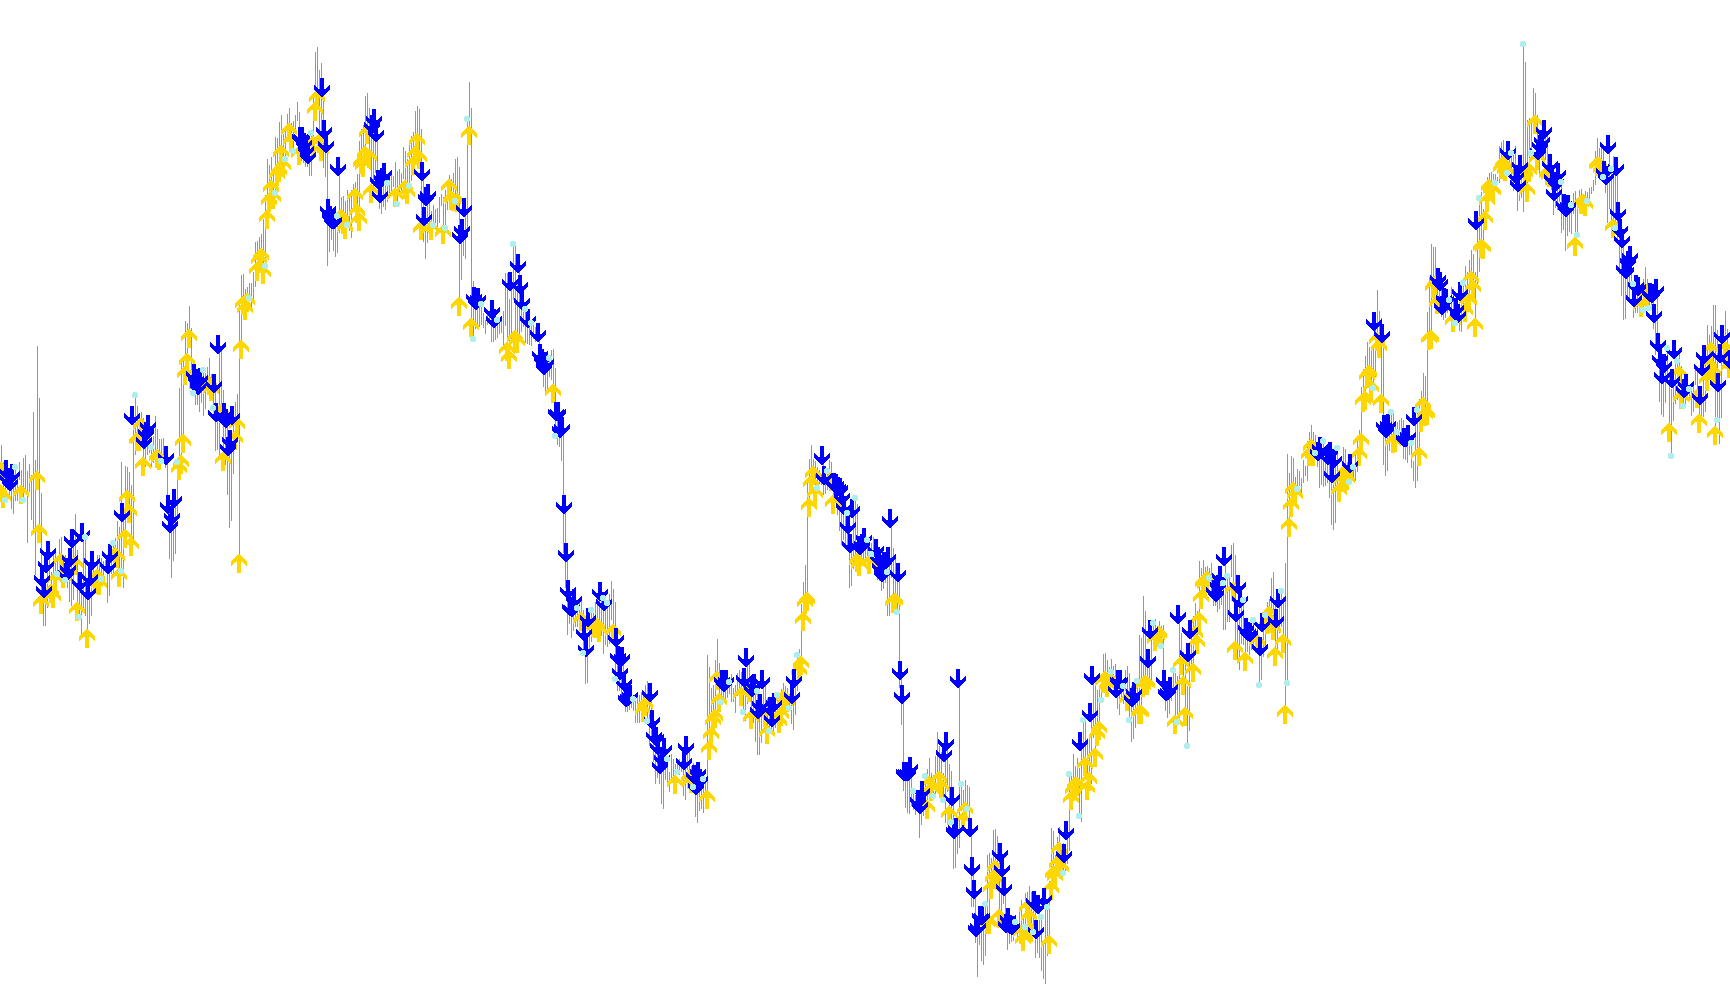
Overview of the Prediction Indicator
This technical tool is designed to analyze market price trends and provide visual cues regarding potential upward, downward, or neutral movements. It works by processing historical price data to calculate specific momentum values, which are then translated into on-screen signals (arrows) to help traders identify shifts in market direction.
How the Logic Works
The script follows a three-step analytical process to determine its signals:
1. Price Averaging and Comparison The tool calculates two different types of averages based on recent closing prices:
- A Short-Term Average: Derived from the most immediate price points.
- A Long-Term Average: Derived from a wider range of previous price points.
By comparing these two averages, the tool attempts to determine the underlying "lean" of the market. If the short-term average is higher than the long-term average, it suggests upward momentum; if it is lower, it suggests downward momentum.
2. Momentum Intensity (The "Pr" Value) Simply knowing the direction isn't enough for this script. It also calculates a specific momentum intensity value (referred to as Pr). This formula measures the speed and magnitude of the price change relative to the current market price.
For a signal to be generated, the momentum must exceed a certain threshold (the "BuyLevel" or "SellLevel"). This ensures that the indicator only flags movements that have significant strength, effectively filtering out minor price fluctuations or "noise."
3. Signal Generation and Visuals Based on the results of the averages and the momentum intensity, the tool categorizes the market into three states:
- Upward Signal (Long): Triggered when the short-term average is higher than the long-term average AND the momentum strength exceeds the defined threshold. A blue arrow appears on the chart to signify this potential move.
- Downward Signal (Short): Triggered when the short-term average is lower than the long-term average AND the momentum strength exceeds the defined threshold. A magenta arrow appears to signify this potential move.
- Flat/Neutral Signal: If the momentum is moderate (falling within a specific mid-range) or does not meet the strength requirements, the indicator remains neutral. In some cases, it may display an orange "Flat" marker to indicate a transition between trends.
On-Screen Display
In addition to the visual arrows on the chart, the tool provides a real-time text summary in the corner of your screen. This summary shows the exact calculated momentum value (Pr) and a clear text label identifying the current market state as Long, Short, or Flat.
//+------------------------------------------------------------------+
//|                                        Created by Ronald Verwer. |
//|                                                      Predict.mq4 |
//|                      Copyright; 2006 © by Ronald Verwer/ROVERCOM |
//+------------------------------------------------------------------+
#property copyright "Copyright 2006 © Ronald Verwer / ROVERCOM"
//----
#property indicator_chart_window
#property indicator_buffers 3
#property indicator_color1 Blue
#property indicator_color2 Magenta
#property indicator_color3 Orange
#property indicator_width1 2
#property indicator_width2 2
#property indicator_width3 2
//----
extern int BuyLevel=56;
extern int SellLevel=56;
extern bool    Use_Single_Arrows           =false;//true;
//----
double Up[];
double Dn[];
double Fl[];
double Drctn[];
//+------------------------------------------------------------------+
//| Indicator Initialization Function                                |
//+------------------------------------------------------------------+
int init()
  {
   IndicatorBuffers(4);
   SetIndexStyle(0,DRAW_ARROW,0,2);
   SetIndexArrow(0,233);
   SetIndexStyle(1,DRAW_ARROW,0,2);
   SetIndexArrow(1,234);
   SetIndexStyle(2,DRAW_ARROW,0,2);
   SetIndexArrow(2,159);
   //
   SetIndexBuffer(0,Up);
   SetIndexBuffer(1,Dn);
   SetIndexBuffer(2,Fl);
   SetIndexBuffer(3,Drctn);
   //
   IndicatorShortName("Prediction");
   SetIndexLabel(0,"Up");
   SetIndexLabel(1,"Dn");
   SetIndexLabel(2,"Flat");
   //
   SetIndexDrawBegin(0,10);
   SetIndexDrawBegin(1,10);
   SetIndexDrawBegin(2,10);
//----
   return(0);
  }
//+------------------------------------------------------------------+
//| Indicator De-Initialization Function                             |
//+------------------------------------------------------------------+
int deinit()
  {
   return(0);
  }
//+------------------------------------------------------------------+
//| EMA_Levels                                                       |
//+------------------------------------------------------------------+
int start()
  {
   int i,limit;
   double D1,D2,Pr;
   string Txt;
   int counted_bars=IndicatorCounted();
   if(counted_bars<0) return(-1);
   if(counted_bars>0) counted_bars--;
//----
   limit=Bars-counted_bars;
//----
   for(i=limit;i>=0;i--)
     {
      Up[i]=EMPTY_VALUE;
      Dn[i]=EMPTY_VALUE;
      Fl[i]=EMPTY_VALUE;
      D1=(Close[i+1]+Close[i+2])/2;
      D2=(Close[i+1]+Close[i+2]+Close[i+3]+Close[i+4]+Close[i+5])/5;
      if(Close[i+1]!=0)
         Pr=((MathAbs(D1-D2)/Close[i+1]*125.75 + 0.54528)*10000)/100;
      if(D1>D2 && Pr>BuyLevel)
        {
         Drctn[i]=1;
         if(Drctn[i]!=Drctn[i+1] || !Use_Single_Arrows)
            Up[i]=Low[i] - 4 * Point;
        }
      else if(D1<D2 && Pr>SellLevel)
           {
            Drctn[i]=-1;
            if(Drctn[i]!=Drctn[i+1] || !Use_Single_Arrows)
               Dn[i]=High[i] + 4 * Point;
           }
         else if(Pr>50 && Pr<60)
              {
               Drctn[i]=0;
               if(Drctn[i+1]==1)
                  Fl[i]=Low[i] - 4 * Point;
               else if(Drctn[i+1]==-1)
                     Fl[i]=High[i] + 4 * Point;
              }
            else
               Drctn[i]=0;
     }
   if(Drctn[0]==-1) Txt="Short";
   else if(Drctn[0]==1) Txt="Long";
      else Txt="Flat";
   Comment("Predictions: Pr = "+DoubleToStr(Pr,3)+" ; Current Signal =  "+Txt);
   return(0);
  }
//+------------------------------------------------------------------+
Comments