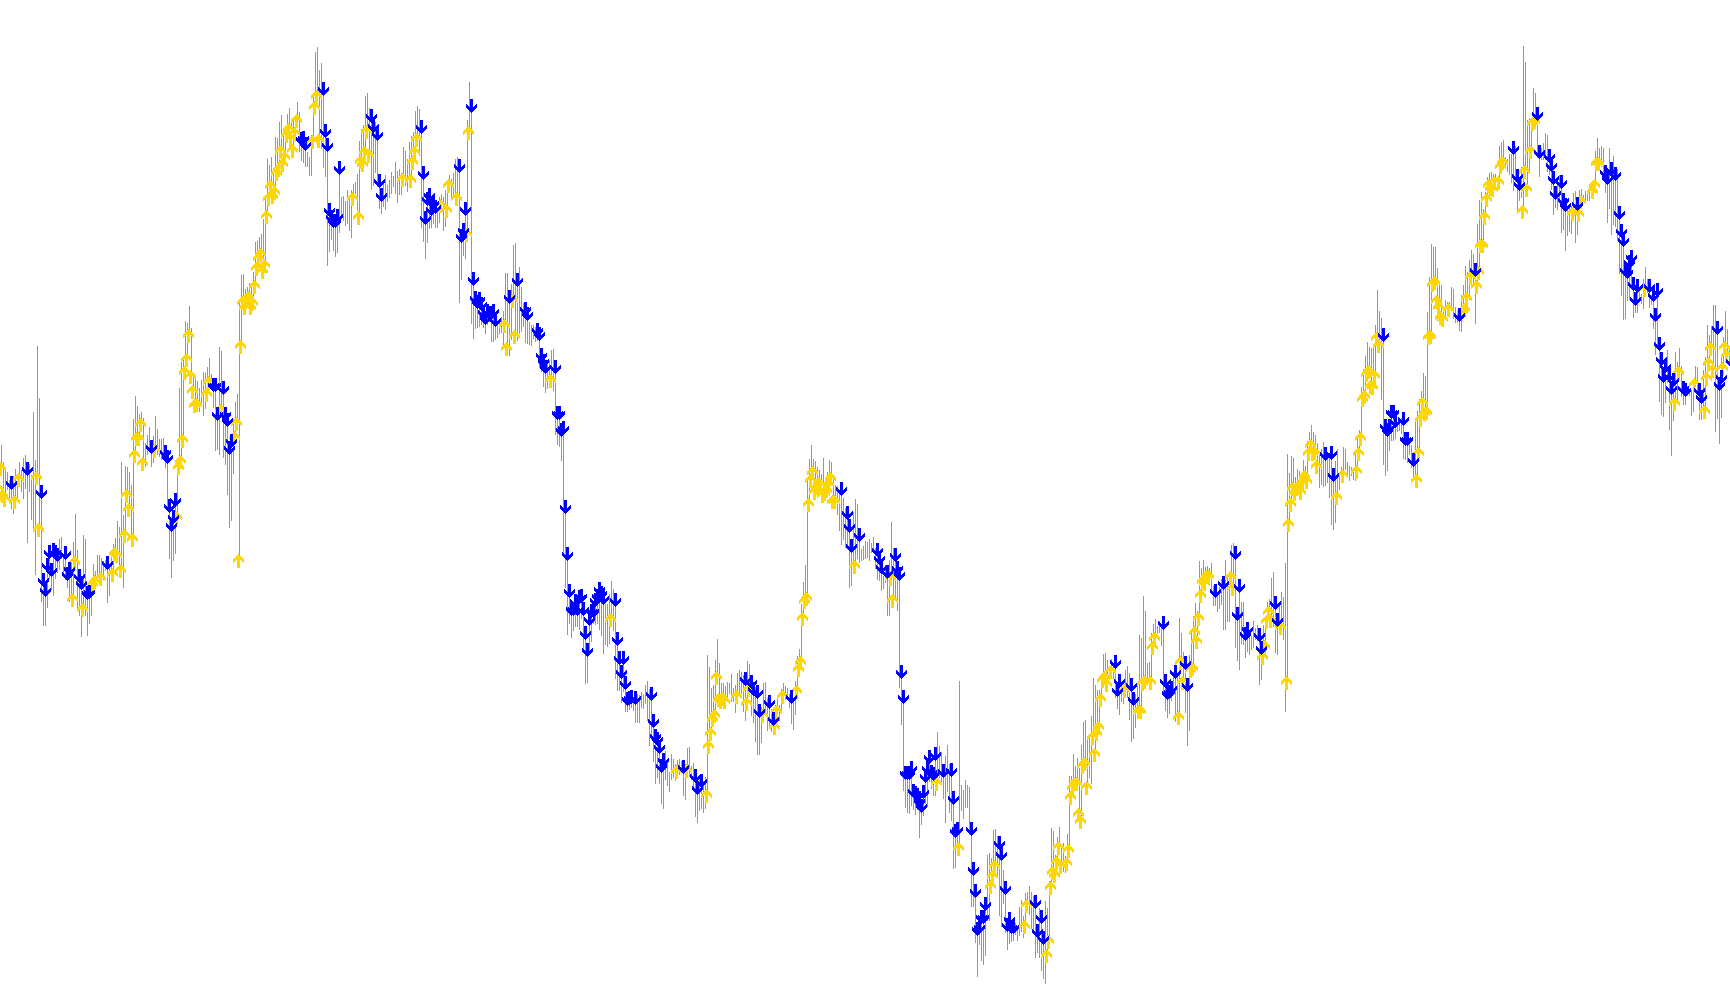
This technical tool is designed to help traders identify significant price movements on a financial chart by visually marking specific "turning points" or shifts in momentum. Rather than relying on standard price fluctuations, the script uses a mathematical calculation to filter out minor market noise, focusing only on substantial changes.
How the Logic Works
Price Point Calculation The indicator begins by determining a consistent reference price for every candle on the chart. Instead of just looking at the closing price (which can be volatile), it calculates an average based on four data points: the high, low, open, and close prices. This provides a more balanced view of the asset's value at any given moment.
The Percentage Threshold A core feature of this script is its use of a specific percentage threshold. You can adjust this sensitivity to determine how much the price must move before a signal is triggered. The logic compares the current average price against a rolling reference value.
Trend Tracking and Signal Generation The tool tracks the "momentum" of the market through two primary actions:
- Buy Signals (Upward Momentum): If the calculated price rises significantly above the previous reference point by your chosen percentage, the script identifies this as a potential upward move. It then places a visual marker (an arrow) at the bottom of that candle to highlight the entry or trend shift.
- Sell Signals (Downward Momentum): Conversely, if the calculated price drops significantly below the previous reference point by that same percentage, the script identifies a potential downward move and places a marker at the top of the candle.
Dynamic Reference Adjustment What makes this logic unique is how it updates itself. Every time a new signal is triggered—whether upward or downward—the "reference price" automatically recalibrates to this new level. This creates a cascading effect where the indicator constantly adjusts its expectations based on the most recent major move, ensuring that signals are relative to the current market structure rather than just starting from a fixed point in history.
Summary for the Trader
Essentially, this script acts as a filter. It ignores small price jitters and only "speaks up" when the market makes a significant enough move to hit your predefined percentage goal. It then visually paints those turning points on your chart to help you identify the overarching direction of the trend.
//+------------------------------------------------------------------+
//|                                               ZigZag Pointer.mq4 |
//|                                    zigzag modified by Dr. Gaines |
//|                                      neamtu_victor@yahoo.com     |
//|                                         neamtu victor            |
//+------------------------------------------------------------------+
#property copyright "neamtu victor"
#property link      "neamtu_victor@yahoo.com"

#property indicator_chart_window
#property indicator_buffers 2
#property indicator_color1 Lime
#property indicator_width1 1
#property indicator_color2 Red
#property indicator_width2 1
//---- indicator parameters
extern double Percent=0.0222222222;
//---- indicator buffers
double buyArrowsBuffer[];
double sellArrowsBuffer[];


//+------------------------------------------------------------------+
//| Custom indicator initialization function                         |
//+------------------------------------------------------------------+


int init()
  {
   IndicatorBuffers(2);
//---- drawing settings
   SetIndexStyle(0,DRAW_ARROW);
   SetIndexArrow(0, 233);//233
   SetIndexStyle(1,DRAW_ARROW);
   SetIndexArrow(1, 234);//234

//---- indicator buffers mapping
   SetIndexBuffer(0,buyArrowsBuffer);
   SetIndexBuffer(1,sellArrowsBuffer);
   SetIndexEmptyValue(0,0.0);

   IndicatorShortName("Percentual ZigZag("+Percent+")");

   Percent /= 100;

   return(0);
  }
//+------------------------------------------------------------------+
//|                                                                  |
//+------------------------------------------------------------------+
double barPrice(int shift){
   double auxPrice=0;

   auxPrice=(iOpen(Symbol(),Period(),shift)+iClose(Symbol(),Period(),shift)+iLow(Symbol(),Period(),shift)+iHigh(Symbol(),Period(),shift))/4;

   return(auxPrice);
}


int start(){

   int shift;
   static double value;

   int counted_bars=IndicatorCounted();
   if(counted_bars<0)
      return(-1);

   int limit=Bars-counted_bars-1;


   for(shift=Bars-1; shift>=0; shift--){

      if (shift == Bars-1){
         value=barPrice(Bars-1);
     }
      else{
         //Print(" barPrice: ", barPrice(shift), " value+p.. ", value );
         if (barPrice(shift) > value + Percent*value){
            buyArrowsBuffer[shift]=iLow(Symbol(),Period(),shift)-1*Point;
            sellArrowsBuffer[shift]=0;
            value=value + Percent*value;
            //Print("Bars ",Bars, " Shift ",shift," barPrice: ", value);
         }


         if (barPrice(shift) < value - Percent*value){
            sellArrowsBuffer[shift]=iHigh(Symbol(),Period(),shift)+1*Point;
            buyArrowsBuffer[shift]=0;
            value=value - Percent*value;
            //Print("Bars ",Bars, " Shift ",shift," barPrice: ", value);
         }
  //
     }


   }


}

  //end//
Comments