Pivot_WeeklyColorMod_cor
Download script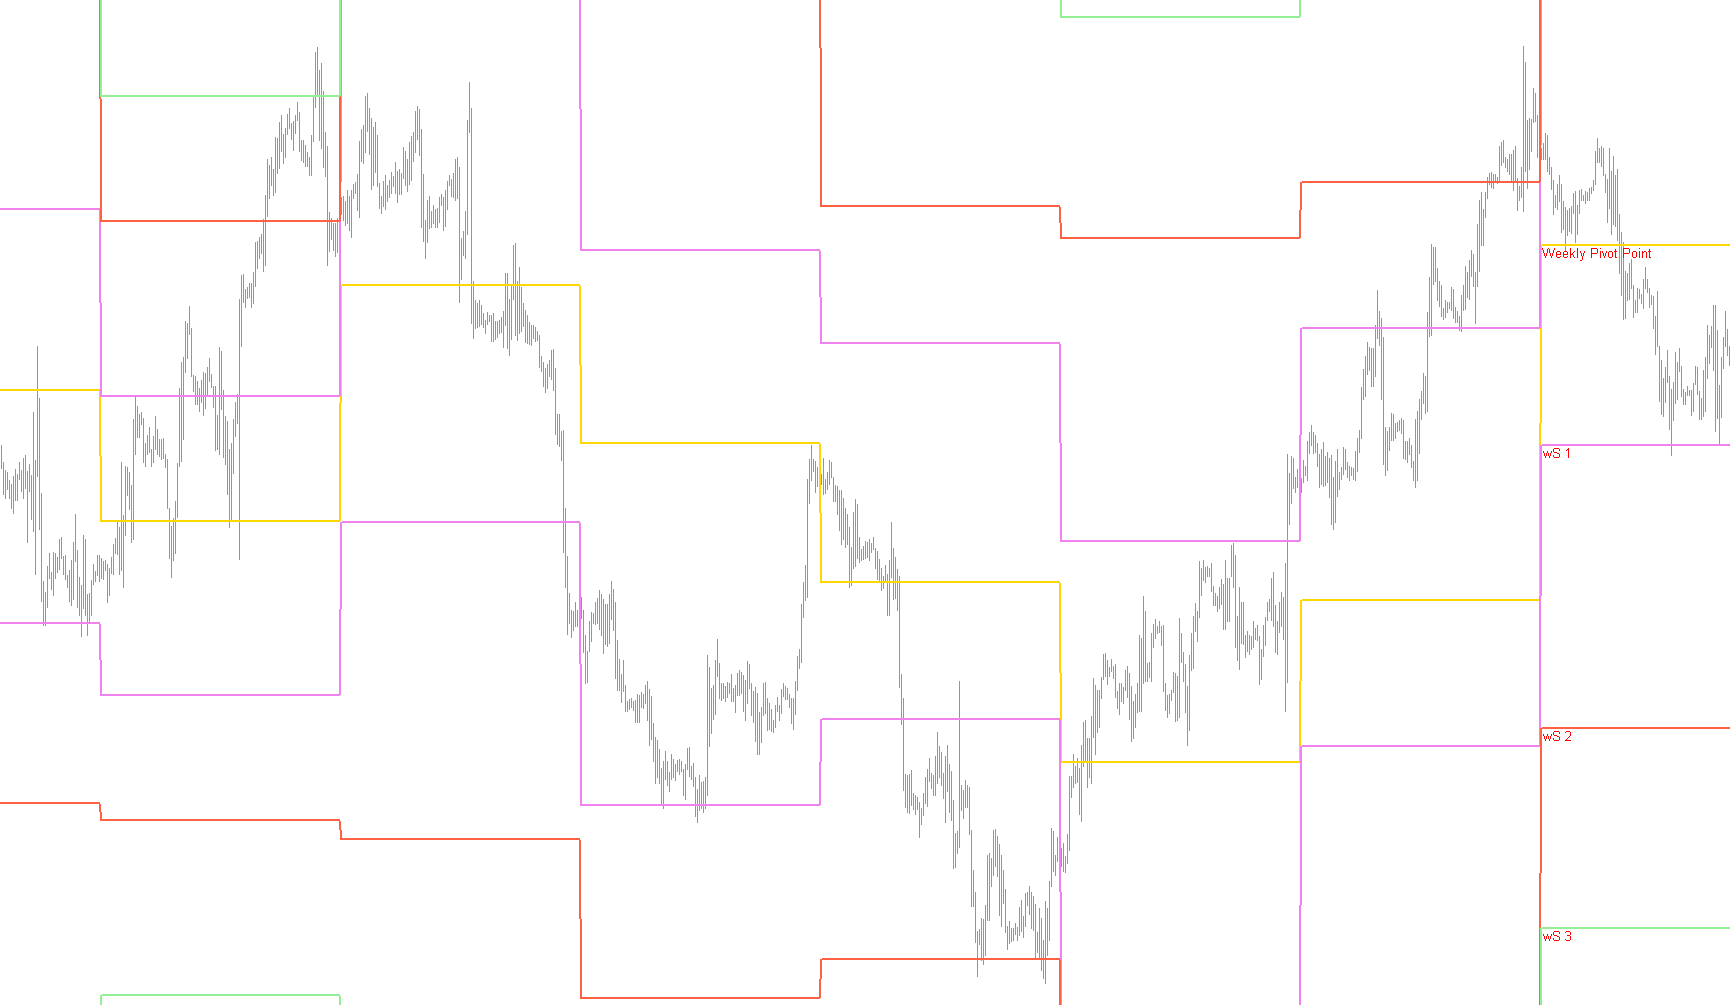
This script is designed as a technical analysis tool for trading platforms, specifically used to identify and display "Weekly Pivot Points" on a price chart. Pivot points are essential landmarks used by traders to determine the potential support and resistance levels of a financial market over a specific timeframe—in this case, the weekly cycle.
How the Logic Works
The script automatically calculates and draws seven distinct price levels on your chart based on the price action from the previous week. Here is a breakdown of how it processes that information:
1. Identifying the Weekly Transition The tool monitors the time and date of the market data. Every time it detects a Monday (the start of a new trading week), it "looks back" at the price movement from the preceding week to gather three critical pieces of data: the highest price reached, the lowest price reached, and the closing price.
2. Calculating the Core Pivot Point Using those three values from the previous week, the script calculates the Weekly Pivot Point (P). This serves as the "equilibrium" or the central balance point for the current week's trading activity.
3. Mapping Support and Resistance Levels Once the central Pivot Point is established, the script uses mathematical formulas to project out additional levels:
- Resistance Levels (R1, R2, R3): These represent "ceiling" prices. They are areas where upward price momentum may struggle to continue, as sellers often step in at these marks.
- Support Levels (S1, S2, S3): These represent "floor" prices. They are areas where downward momentum might stall, as buyers are often expected to enter the market at these levels.
4. Dynamic Visual Updates The script is designed to be reactive. It constantly scans the current price movement to ensure that the high and low points of the current week are being tracked accurately. As the week progresses, it maintains the visual lines on your chart so you can see exactly where these significant psychological boundaries sit in real-time.
Summary of Visual Elements
The indicator populates your chart with a series of colored lines and labels:
- Pivot Point: The central baseline for the week.
- Support Lines: Visualized to help identify potential buying opportunities or price bottoms.
- Resistance Lines: Visualized to help identify potential selling opportunities or price tops.
By providing these levels automatically, the script helps traders quickly visualize where the market "should" react, allowing for better planning of entry and exit points throughout the trading week.
//+------------------------------------------------------------------+
//|                                                  WeeklyPivot.mq4 |
//|                                            originally: Pivot.mq4 |
//|                               Copyright © 2004, Poul_Trade_Forum |
//|                                                         Aborigen |
//|                                          http://forex.kbpauk.ru/ |
//+------------------------------------------------------------------+
#property copyright "Poul Trade Forum"
#property link      "http://forex.kbpauk.ru/"

#property indicator_chart_window
#property indicator_buffers 7
#property indicator_color1 Gold
#property indicator_color2 Violet
#property indicator_color3 Violet
#property indicator_color4 Tomato
#property indicator_color5 Tomato
#property indicator_color6 LightGreen
#property indicator_color7 LightGreen
//---- input parameters

//---- buffers
double PBuffer[];
double S1Buffer[];
double R1Buffer[];
double S2Buffer[];
double R2Buffer[];
double S3Buffer[];
double R3Buffer[];
string Pivot="WeeklyPivotPoint",Sup1="W_S 1", Res1="W_R 1";
string Sup2="W_S 2", Res2="W_R 2", Sup3="W_S 3", Res3="W_R 3";
int fontsize=10;
double P,S1,R1,S2,R2,S3,R3;
double last_week_high, last_week_low, this_week_open, last_week_close;

//+------------------------------------------------------------------+
//| Custor indicator deinitialization function                       |
//+------------------------------------------------------------------+
int deinit()
  {
//---- TODO: add your code here

   ObjectDelete("WeeklyPivot");
   ObjectDelete("Sup1");
   ObjectDelete("Res1");
   ObjectDelete("Sup2");
   ObjectDelete("Res2");
   ObjectDelete("Sup3");
   ObjectDelete("Res3");

//----
   return(0);
  }
//+------------------------------------------------------------------+
//| Custom indicator initialization function                         |
//+------------------------------------------------------------------+
int init()
  {
   string short_name;


//---- indicator line
   SetIndexStyle(0,DRAW_LINE,0,2,Gold);
   SetIndexStyle(1,DRAW_LINE,0,2,Violet);
   SetIndexStyle(2,DRAW_LINE,0,2,Violet);
   SetIndexStyle(3,DRAW_LINE,0,2,Tomato);
   SetIndexStyle(4,DRAW_LINE,0,2,Tomato);
   SetIndexStyle(5,DRAW_LINE,0,2,LightGreen);
   SetIndexStyle(6,DRAW_LINE,0,2,LightGreen);
   SetIndexBuffer(0,PBuffer);
   SetIndexBuffer(1,S1Buffer);
   SetIndexBuffer(2,R1Buffer);
   SetIndexBuffer(3,S2Buffer);
   SetIndexBuffer(4,R2Buffer);
   SetIndexBuffer(5,S3Buffer);
   SetIndexBuffer(6,R3Buffer);


//---- name for DataWindow and indicator subwindow label
   short_name="WeeklyPivotPoint";
   IndicatorShortName(short_name);
   SetIndexLabel(0,short_name);

//----
   SetIndexDrawBegin(0,1);
//----


//----
   return(0);
  }

//+------------------------------------------------------------------+
//| Custom indicator iteration function                              |
//+------------------------------------------------------------------+
int start()

  {
   int counted_bars=IndicatorCounted();

   int limit, i;
//---- indicator calculation
if (counted_bars==0)
{

   ObjectCreate("WeeklyPivot", OBJ_TEXT, 0, 0,0);
   ObjectSetText("WeeklyPivot", "                            Weekly Pivot Point",fontsize,"Arial",Red);
   ObjectCreate("Sup1", OBJ_TEXT, 0, 0, 0);
   ObjectSetText("Sup1", "        wS 1",fontsize,"Arial",Red);
   ObjectCreate("Res1", OBJ_TEXT, 0, 0, 0);
   ObjectSetText("Res1", "        wR 1",fontsize,"Arial",Red);
   ObjectCreate("Sup2", OBJ_TEXT, 0, 0, 0);
   ObjectSetText("Sup2", "        wS 2",fontsize,"Arial",Red);
   ObjectCreate("Res2", OBJ_TEXT, 0, 0, 0);
   ObjectSetText("Res2", "        wR 2",fontsize,"Arial",Red);
   ObjectCreate("Sup3", OBJ_TEXT, 0, 0, 0);
   ObjectSetText("Sup3", "        wS 3",fontsize,"Arial",Red);
   ObjectCreate("Res3", OBJ_TEXT, 0, 0, 0);
   ObjectSetText("Res3", "        wR 3",fontsize,"Arial",Red);
}
   if(counted_bars<0) return(-1);

   limit=(Bars-counted_bars)-1;


for (i=limit; i>=0;i--)
{


   // Monday
	if ( 1 == TimeDayOfWeek(Time[i]) && 1 != TimeDayOfWeek(Time[i+1]) )
	{
		last_week_close = Close[i+1];
		this_week_open = Open[i];

		// WeeklyPivot
		P = (last_week_high + last_week_low + last_week_close) / 3;

   R1 = (2*P)-last_week_low;
   S1 = (2*P)-last_week_high;
   R2 = P+(last_week_high - last_week_low);
   S2 = P-(last_week_high - last_week_low);
   R3 = (2*P)+(last_week_high-(2*last_week_low));
   S3 = (2*P)-((2* last_week_high)-last_week_low);

   last_week_low=Low[i]; last_week_high=High[i];

	ObjectMove("WeeklyPivot", 0, Time[i],P);
   ObjectMove("Sup1", 0, Time[i],S1);
   ObjectMove("Res1", 0, Time[i],R1);
   ObjectMove("Sup2", 0, Time[i],S2);
   ObjectMove("Res2", 0, Time[i],R2);
   ObjectMove("Sup3", 0, Time[i],S3);
   ObjectMove("Res3", 0, Time[i],R3);

}

    last_week_high = MathMax(last_week_high, High[i]);
 	 last_week_low = MathMin(last_week_low, Low[i]);
    PBuffer[i]=P;
    S1Buffer[i]=S1;
    R1Buffer[i]=R1;
    S2Buffer[i]=S2;
    R2Buffer[i]=R2;
    S3Buffer[i]=S3;
    R3Buffer[i]=R3;

}

//----
   return(0);
  }
//+------------------------------------------------------------------+
Comments