Predict
Download script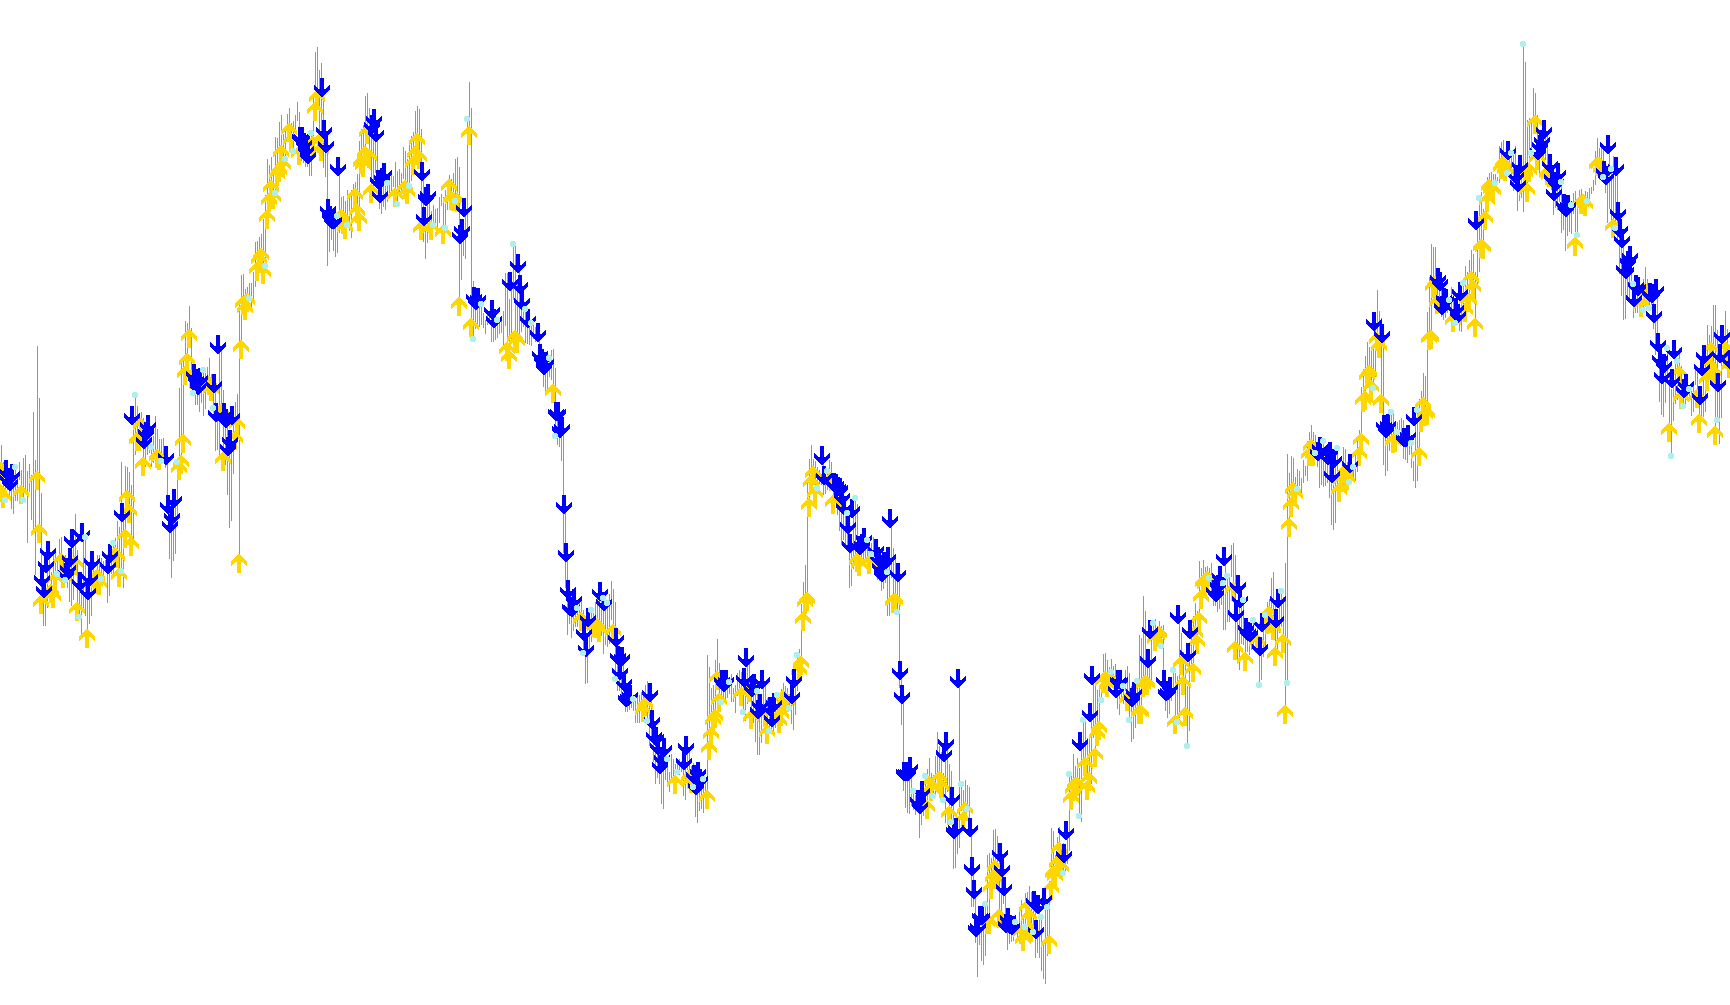
This technical script is designed as a visual forecasting tool for traders, providing real-time signals on the market's direction. Rather than simply following existing price movements, it uses a mathematical approach to identify momentum shifts and potential trend reversals.
Core Logic and Methodology
The tool operates by analyzing the relationship between two different types of averages of recent price data:
- Short-Term Analysis: The script looks at the average price over a very small window (the last 2 candles).
- Medium-Term Analysis: It simultaneously calculates a broader average across a larger window (the last 5 candles).
By comparing these two averages, the tool measures the "tension" or momentum between the immediate price action and the broader trend. It then calculates a specific Prediction Value (Pr). This value essentially quantifies how strongly the market is leaning in one direction relative to its recent history.
Signal Generation
The script interprets these mathematical values to provide three distinct types of visual signals on your chart:
- Buy Signals (Up): When the short-term average is higher than the medium-term average and the Prediction Value exceeds a pre-defined threshold, the script identifies bullish momentum.
- Sell Signals (Down): Conversely, when the short-term average falls below the medium-term average and the Prediction Value meets the sell threshold, it identifies bearish momentum.
- Flat Signals: If the market is showing low volatility or a "neutral" prediction value (specifically between 50 and 60), the script signals a "Flat" state, suggesting there is no clear direction for the price to move at that moment.
User Experience Features
- Visual Cues: The script places specific colored arrows on the chart to highlight these entries, making it easier for traders to spot transitions from one trend to another.
- Dynamic Filtering: It includes a toggle to choose between showing every signal or only the primary "single" arrow, helping to clean up the chart visually depending on your trading style.
- Real-Time Dashboard: In addition to the visual arrows, the script provides a live text commentary on the screen. This tells you the exact Prediction Value at any given second and summarizes whether the current market sentiment is categorized as "Long," "Short," or "Flat."
/*-----------------------------+
|			       |
| Shared by www.Aptrafx.com    |
|			       |
+------------------------------*/

//+------------------------------------------------------------------+
//|                                        Created by Ronald Verwer. |
//|                                                      Predict.mq4 |
//|                      Copyright; 2006 © by Ronald Verwer/ROVERCOM |
//+------------------------------------------------------------------+

#property copyright "Copyright 2006 © Ronald Verwer / ROVERCOM"

#property indicator_chart_window
#property indicator_buffers 3

#property indicator_color1 Blue
#property indicator_color2 Magenta
#property indicator_color3 Orange
#property indicator_width1 2
#property indicator_width2 2
#property indicator_width3 2

extern int BuyLevel = 56;
extern int SellLevel = 56;

extern bool    Use_Single_Arrows            = false;//true;

double Up[];
double Dn[];
double Fl[];
double Drctn[];

//+------------------------------------------------------------------+
//| Indicator Initialization Function                                |
//+------------------------------------------------------------------+

int init()
   {
   IndicatorBuffers(4);
   SetIndexStyle(0,DRAW_ARROW,0,2);
   SetIndexArrow(0,233);
   SetIndexStyle(1,DRAW_ARROW,0,2);
   SetIndexArrow(1,234);
   SetIndexStyle(2,DRAW_ARROW,0,2);
   SetIndexArrow(2,159);

   SetIndexBuffer(0,Up);
   SetIndexBuffer(1,Dn);
   SetIndexBuffer(2,Fl);
   SetIndexBuffer(3,Drctn);

   IndicatorShortName("Prediction");
   SetIndexLabel(0,"Up");
   SetIndexLabel(1,"Dn");
   SetIndexLabel(2,"Flat");
//----
   SetIndexDrawBegin(0,10);
   SetIndexDrawBegin(1,10);
   SetIndexDrawBegin(2,10);
//----
   return(0);
   }

//+------------------------------------------------------------------+
//| Indicator De-Initialization Function                             |
//+------------------------------------------------------------------+

int deinit()
   {
   return(0);
   }

//+------------------------------------------------------------------+
//| EMA_Levels                                                       |
//+------------------------------------------------------------------+

int start()
  {
   int i,limit;
   double D1,D2,Pr;
   string Txt;
   int counted_bars=IndicatorCounted();
   if(counted_bars<0) return(-1);
   if(counted_bars>0) counted_bars--;
   limit=Bars-counted_bars;

	for(i=limit;i>=0;i--)
      {
      Up[i] = EMPTY_VALUE;
      Dn[i] = EMPTY_VALUE;
      Fl[i] = EMPTY_VALUE;

      D1=(Close[i+1]+Close[i+2])/2;
      D2=(Close[i+1]+Close[i+2]+Close[i+3]+Close[i+4]+Close[i+5])/5;
      if(Close[i+1]!=0)
         Pr=((MathAbs(D1-D2)/Close[i+1]*125.75 + 0.54528)*10000)/100;

      if(D1>D2 && Pr>BuyLevel)
         {
         Drctn[i] = 1;
         if(Drctn[i] != Drctn[i+1] || !Use_Single_Arrows)
            Up[i] = Low[i] - 4 * Point;
         }
      else if(D1<D2 && Pr>SellLevel)
         {
         Drctn[i] = -1;
         if(Drctn[i] != Drctn[i+1] || !Use_Single_Arrows)
            Dn[i] = High[i] + 4 * Point;
         }
      else if(Pr>50 && Pr<60)
            {
            Drctn[i] = 0;
            if(Drctn[i+1]==1)
               Fl[i] = Low[i] - 4 * Point;
            else if(Drctn[i+1]==-1)
               Fl[i] = High[i] + 4 * Point;
            }
      else
         Drctn[i] = 0;
      }
   if(Drctn[0]==-1) Txt="Short";
   else if(Drctn[0]==1) Txt="Long";
   else Txt="Flat";

   Comment("Predictions: Pr = "+DoubleToStr(Pr,3)+" ; Current Signal =  "+Txt);
	return(0);
   }

//----
Comments