pOH
Download script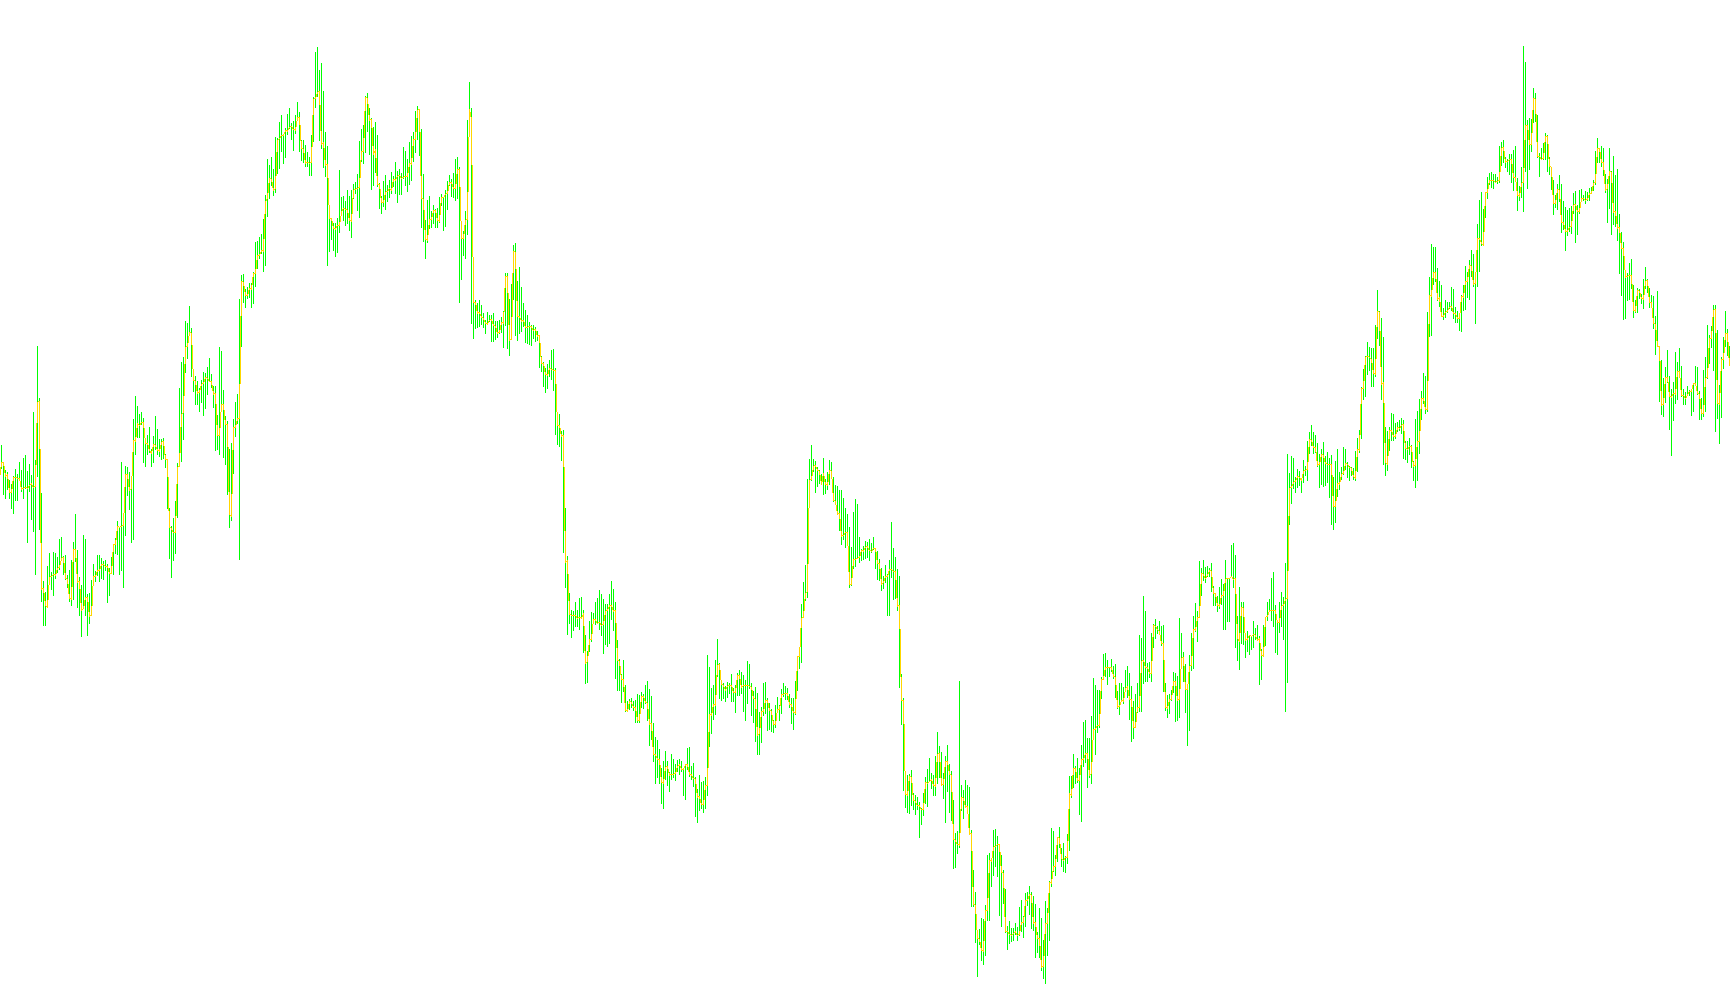
This script is a visual charting tool designed for the MetaTrader platform. Its primary purpose is to create a custom trend line on your chart by weaving together different price points from historical data.
How it Works
The logic follows a specific pattern to draw a continuous line across your trading screen. Instead of simply tracking one type of price (like only the closing price or only the opening price), this tool alternates between them at every step.
The Alternation Process:
- Step One: The script identifies a specific point in time and plots the Closing Price of a candle from a designated distance back in history.
- Step Two: For the very next point on the line, it switches and plots the Opening Price of that same historical distance.
- The Cycle: It repeats this "Close-then-Open" pattern continuously across the entire visible history of the chart.
Key Features
- Lookback Adjustment: You can define a "lookback" value, which allows you to shift the data point being analyzed further into the past. This helps in observing historical trends rather than just focusing on the most recent price action.
- Visual Representation: The script renders this alternating data as a red line directly on your main chart window, providing a unique visual path that combines two different types of price movements into one continuous flow.
In essence, this tool provides a "zigzag" style visualization that blends the conclusion of one candle with the beginning of another, helping you see a combined perspective of price action over time.
Miscellaneous
14
Views
0
Downloads
0
Favorites
pOH
#property indicator_chart_window
#property indicator_buffers 1
#property indicator_color1 Red
double ExtMapBuffer1[];
int ExtCountedBars=0;
extern int lookback = 0;
int init()
  {
   SetIndexStyle(0,DRAW_LINE, 0, 1);
   SetIndexBuffer(0, ExtMapBuffer1);

   return(0);
  }
int start()
  {
   int i=Bars-ExtCountedBars-1;
   int x = 0;
   while(i>=0)
     {
      if(x == 0){
      ExtMapBuffer1[i] = Close[i+lookback];
      x = 1;
      }
      else{
      x = 0;
      ExtMapBuffer1[i] = Open[i+lookback];
      }
 	   i--;
     }
   return(0);
  }
Comments