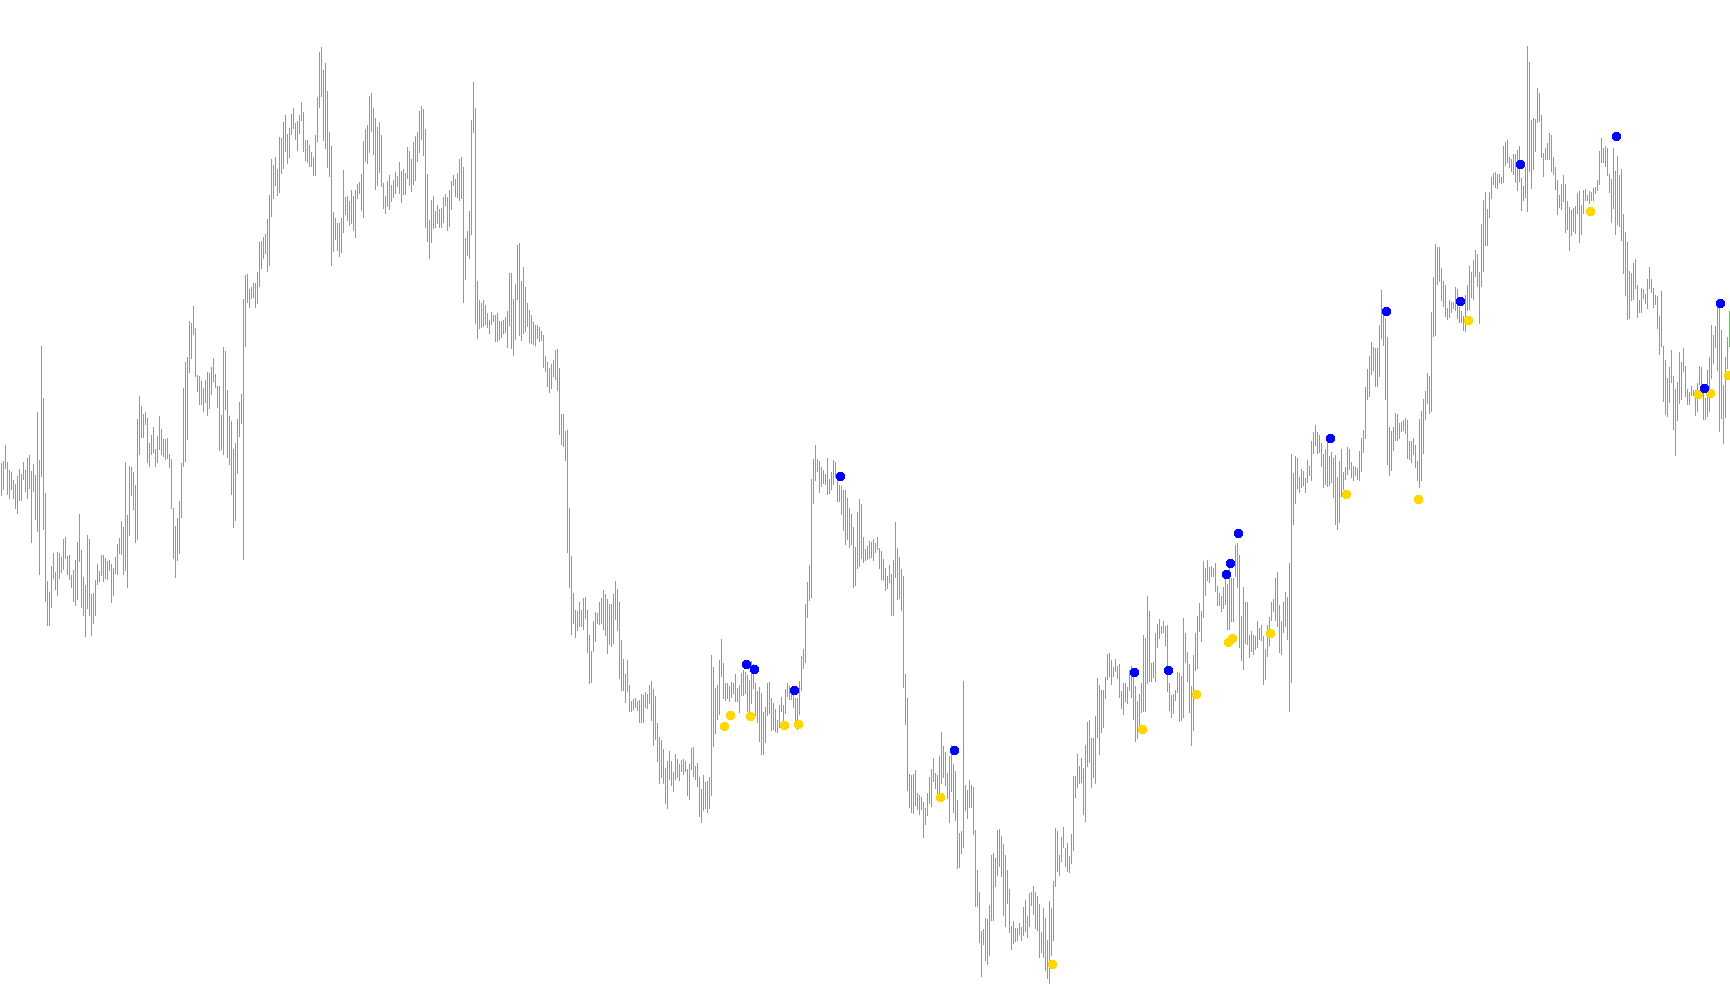
The ASCtrend script is a technical analysis tool designed to identify specific momentum shifts and trend reversals on a trading chart. Instead of simply following standard price movements, it uses a multi-layered logic system to filter out "noise" and pinpoint high-probability entry points.
Here is a breakdown of how the logic functions:
1. Dynamic Volatility Assessment
The script begins by measuring the "personality" of the current market. It calculates the average range of price candles over a specific lookback period. This means the tool understands whether the market is currently calm or volatile. It uses this average range as a benchmark to determine what constitutes a significant price move versus a minor fluctuation.
2. Movement Validation (The "Truth" Filters)
To ensure it doesn't give false signals, the script applies two distinct filters to verify price action:
- Gap/Jump Detection: It looks for instances where the price has moved significantly relative to the average range. Specifically, it checks if a move is large enough to suggest a genuine break in trend rather than just normal market breathing.
- Momentum Confirmation: It analyzes the relationship between consecutive closing prices. If the price moves by a specific multiple of the average range within a short timeframe, it confirms that momentum is actively shifting in a particular direction.
3. The Oscillator Integration
The script incorporates a modified version of a momentum oscillator. By adjusting the "period" of this oscillator based on the volatility filters mentioned above, the tool can switch its sensitivity. If the market shows strong, clear movements, it adjusts its internal settings to stay tuned to the trend; if movements are weak, it recalibrates to capture smaller shifts.
4. Trend Detection & Signal Execution
The final logic layer monitors where the price sits relative to "Overbought" and "Oversold" levels:
- Buy Signals: If the momentum indicator shows the market is reaching an oversold state (low values) and then moves back toward a neutral zone, the script identifies a potential upward trend and flags a "Buy" signal.
- Sell Signals: Conversely, if the indicator shows the market is becoming overbought (high values) and begins to retreat toward a neutral zone, it identifies a potential downward trend and flags a "Sell" signal.
5. Visual and Audio Alerts
When the logic confirms a high-probability reversal:
- The script places visual markers (arrows) on the chart to highlight the entry point.
- It triggers a real-time alert notification to inform the user of the specific "Buy" or "Sell" opportunity immediately as it occurs.
//+------------------------------------------------------------------+
//|                                                ASCtrend.mq4 |
//|                      Copyright © 2005, MetaQuotes Software Corp. |
//|                                        http://www.metaquotes.net |
//+------------------------------------------------------------------+
#property copyright "Copyright © 2005, MetaQuotes Software Corp."
#property link      "http://www.metaquotes.net"
#property indicator_chart_window
#property indicator_buffers 3
#property indicator_color1 Aqua
#property indicator_color2 Magenta

extern int RISK=6;
extern int AllBars=500;
int up=0,dn=0;
double val1buffer[];
double val2buffer[];
double val3buffer[];
//+------------------------------------------------------------------+
//| Custom indicator initialization function                         |
//+------------------------------------------------------------------+
int init()
  {
//---- indicators
      SetIndexStyle(0,DRAW_ARROW,EMPTY);
      SetIndexArrow(0,108);
      SetIndexBuffer(0, val1buffer);

      SetIndexStyle(1,DRAW_ARROW,EMPTY);
      SetIndexArrow(1,108);
      SetIndexBuffer(1, val2buffer);


      SetIndexStyle(2,DRAW_ARROW,EMPTY);
      SetIndexArrow(2,108);
      SetIndexBuffer(2, val3buffer);
      return(0);
  }
//+------------------------------------------------------------------+
//| Custom indicator deinitialization function                       |
//+------------------------------------------------------------------+
int deinit()
   {
     return(0);
   }
//+------------------------------------------------------------------+
//| Custom indicator iteration function                              |
//+------------------------------------------------------------------+
// int    counted_bars=IndicatorCounted();

int start()
{
   double value2;
   double value3;
   double value10=10;
   double value11;
   double x1=70;
   double x2=30;
   int TrueCount;
   int counter;
   int MRO1;
   int MRO2;
   int i1;
   double Range;
   double AvgRange;
   double val1;
   double val2;
   double Table_value2[500][2];
   int counted_bars=IndicatorCounted();

   value10=3+RISK*2;
   x1=67+RISK;
   x2=33-RISK;
   value11=value10;
  //----------------------------

   if(counted_bars<0) return (-1);
   if(counted_bars>0) counted_bars--;       //last bar recounted
   int i;
   int shift = Bars-counted_bars-1;
   if (shift > AllBars) shift = AllBars;

  for(i=shift; i>0; i--)
   {


      counter=i;
      Range=0;
      AvgRange=0;
      for (counter=i ;counter<=i+9;counter++)
      {
         AvgRange=AvgRange+MathAbs(High[counter]-Low[counter]);
      }
      Range=AvgRange/10;


      counter=i;
      TrueCount=0;
      while (counter<i+9 && TrueCount<1)
      {
         if (MathAbs(Open[counter]-Close[counter+1])>=Range*2.0 )
               TrueCount++;
         counter++;
      }

      if (TrueCount>=1)
            MRO1=counter ;
      else
            MRO1=-1;

      counter=i;
      TrueCount=0;
      while (counter<i+6 && TrueCount<1)
      {
           if(MathAbs(Close[counter+3]-Close[counter])>=Range*4.6)
            {TrueCount++;}
           counter++;
      }

      if(TrueCount>=1)
            MRO2=counter;
      else
            MRO2=-1;

      if (MRO1>-1)
            value11=3;
      else
            value11=value10;

      if (MRO2>-1)
            value11=4;
      else
           value11=value10;


      value2=100-MathAbs(iWPR(NULL,0,value11,i));
      Table_value2[i][0]=i;
      Table_value2[i][1]=value2;
      val1=0;
      val2=0;
      value3=0;
      //-------------------     val1
      if (value2<x2 )  //  x2 = 30
      {
         i1=1;
         while (Table_value2[i+i1][1]>=x2 && Table_value2[i+i1][1]<=x1)
         {i1++;}

         if (Table_value2[i+i1][1]>x1)
         {
            value3=High[i]+Range*0.5;
            val1=value3;
         }
      }

      //-------------------     val2
      if ( value2>x1) // x1 = 70
      {
            i1=1;
            while (Table_value2[i+i1][1]>=x2 && Table_value2[i+i1][1]<=x1)
            {i1++;}

            if (Table_value2[i+i1][1]< x2)
            {
               value3=Low[i]-Range*0.5;
               val2=value3;
            }
      }


//           Alert ("val3buffer[0]=",val3buffer[0],"val3buffer[1]=",val3buffer[1]);
      if (val2!=0 && up==0 )
      {
           val1buffer[i]= val2-1*Point;

           up=1;
           dn=0;
           if(shift<=2)
           {
           Alert (Symbol()," ",Period(),"M  Asctrend BUY ");
           val3buffer[0]=1;
           val3buffer[1]=0;
           Sleep(10000);
           return(0);
                       }
      }
      if (val1 !=0 && dn==0)
      {

           val2buffer[i]= val1+1*Point;

            dn=1;
            up=0;
            if(shift<=2)
            {
            Alert (Symbol()," ",Period(),"M   Asctrend SELL ");
            val3buffer[0]=0;
            val3buffer[1]=1;
            Sleep(10000);
            return(0);
            }
       }

   }
return(0);

}
Comments