Percent R - PCR
Download script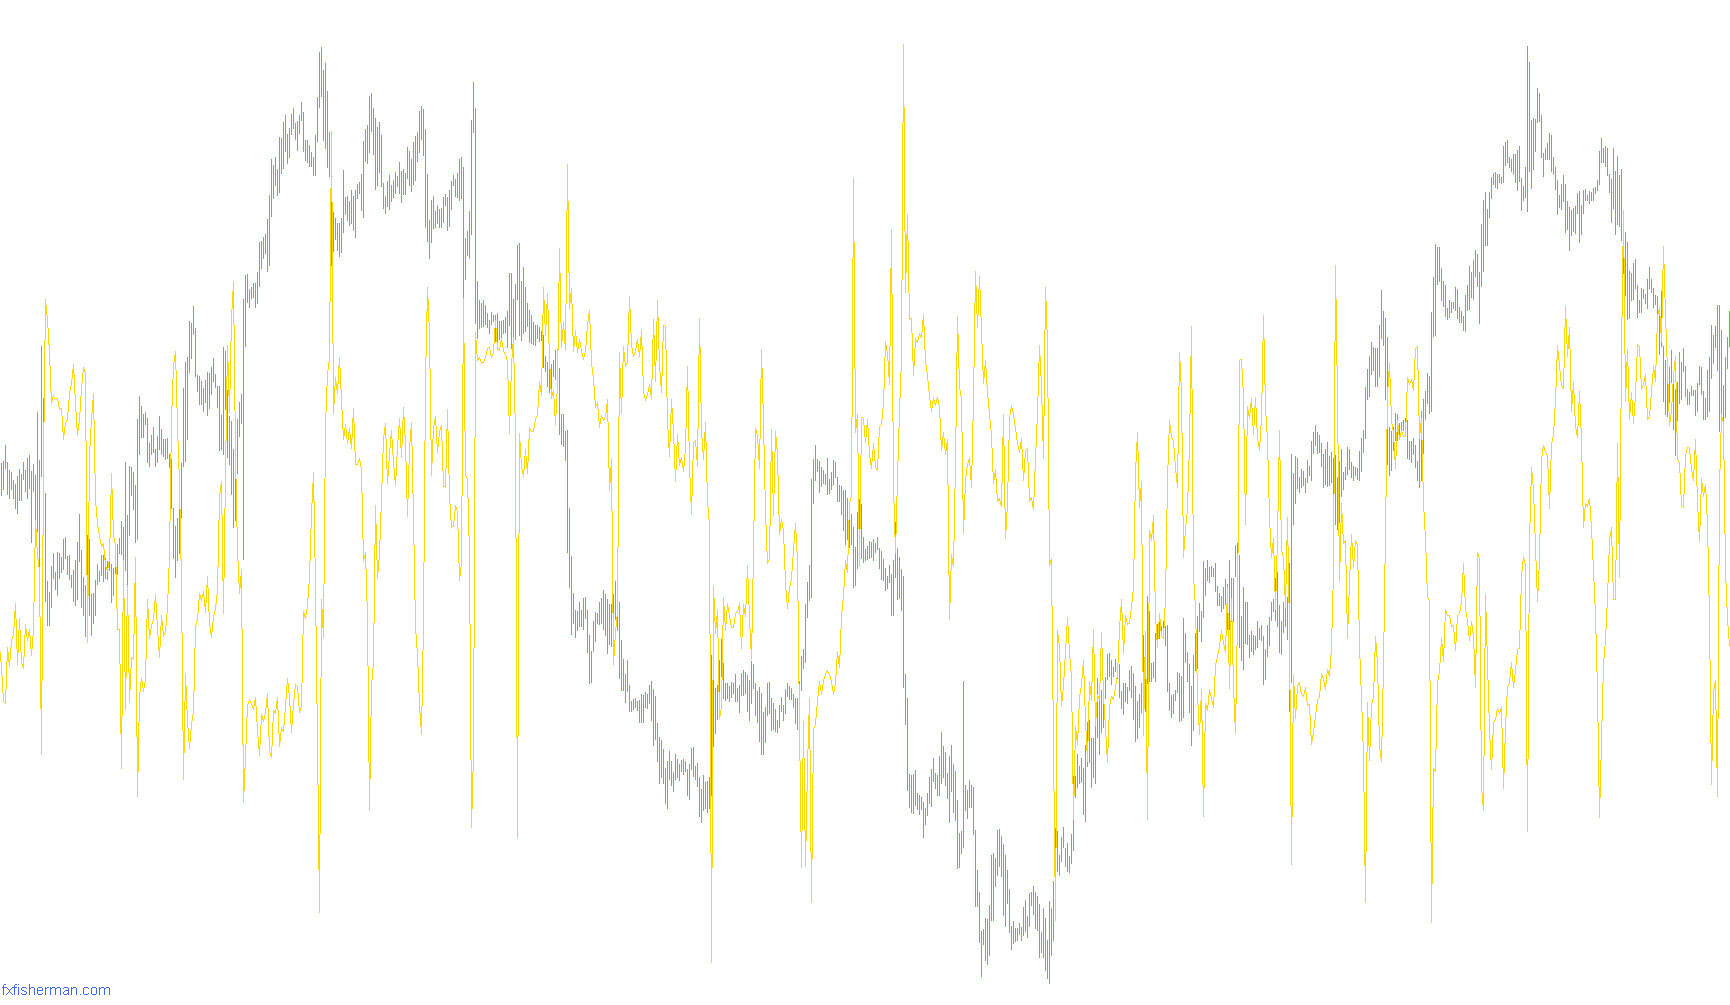
The PercentR indicator is designed to provide traders with a visual representation of where the current market price sits relative to its recent high and low extremes. By converting price action into a percentage, it allows for a clearer understanding of whether an asset is currently "overbought" or "oversold" within a specific timeframe.
How it Works
The logic operates by looking back at a user-defined number of candles (the period) to identify the highest point and the lowest point reached during that time. Once these two boundaries are established, the indicator calculates the current closing price as a percentage of the distance between those two points.
Essentially, it maps the price movement onto a scale of 0% to 100%:
- At 100%: The price is at the very top of its recent range.
- At 0%: The price is at the very bottom of its recent range.
- At 50%: The price is exactly in the middle of its recent range.
Key Features and Visuals
The indicator is displayed in a separate window below the main price chart, allowing you to monitor market sentiment without cluttering your primary view. It includes two distinct horizontal levels:
- Upper Level (80%): Indicates that the price is approaching the upper limits of its recent range, often suggesting the market may be reaching an "overextended" state.
- Lower Level (20%): Indicates that the price is approaching the bottom limits of its recent range, potentially suggesting the market may be nearing a "discounted" state.
Practical Application
By using this tool, traders can quickly identify when a price move has become exhausted or stretched. Instead of looking at raw numbers, you can observe the line's position relative to the 80 and 20 levels. When the line pushes into these zones, it signals that the asset has moved significantly away from its average range, helping traders make more informed decisions about potential reversals or trend continuations.
//+------------------------------------------------------------------+
//|                PercentR - PCR.mq4                                |
//|                Copyright © 2006  Scorpion@fxfisherman.com        |
//+------------------------------------------------------------------+
#property copyright "FxFisherman.com"
#property link      "http://www.fxfisherman.com"

#property indicator_separate_window
#property indicator_buffers 1
#property indicator_color1 Lime
#property indicator_level1 80
#property indicator_level2 20

extern int HL_Period=20;
extern int Shift_Bars=0;
extern int Bars_Count= 1000;

//---- buffers
double v1[];
double val1;

int init()
  {

   IndicatorBuffers(1);

   SetIndexStyle(0,DRAW_LINE,STYLE_SOLID,1);
   SetIndexDrawBegin(0,-1);
   SetIndexBuffer(0, v1);
   SetIndexLabel(0,"PCR");

   watermark();

   return(0);
  }

int start()
 {
  int i;
  int shift;
  double h, l, p;
  int counted_bars = IndicatorCounted();
  if (counted_bars > 0) counted_bars--;
  if (Bars_Count > 0 && Bars_Count <= Bars)
  {
    i = Bars_Count - counted_bars;
  }else{
    i = Bars - counted_bars;
  }

  while(i>=0)
   {
    shift = i + Shift_Bars;
    h = High[Highest(Symbol(), Period(), MODE_HIGH, HL_Period, shift + 1)];
    l = Low[Lowest(Symbol(), Period(), MODE_LOW, HL_Period, shift + 1)];
    p = Close[shift];
    if (h > 0 && p > 0 && l > 0)
    {
      v1[i] = ((h-p)/(h-l))*100;
    }
    i--;
   }
  return(0);
 }

//+------------------------------------------------------------------+

void watermark()
  {
   ObjectCreate("fxfisherman", OBJ_LABEL, 0, 0, 0);
   ObjectSetText("fxfisherman", "fxfisherman.com", 11, "Lucida Handwriting", RoyalBlue);
   ObjectSet("fxfisherman", OBJPROP_CORNER, 2);
   ObjectSet("fxfisherman", OBJPROP_XDISTANCE, 5);
   ObjectSet("fxfisherman", OBJPROP_YDISTANCE, 10);
   return(0);
  }
Comments