PDF_v1
Download script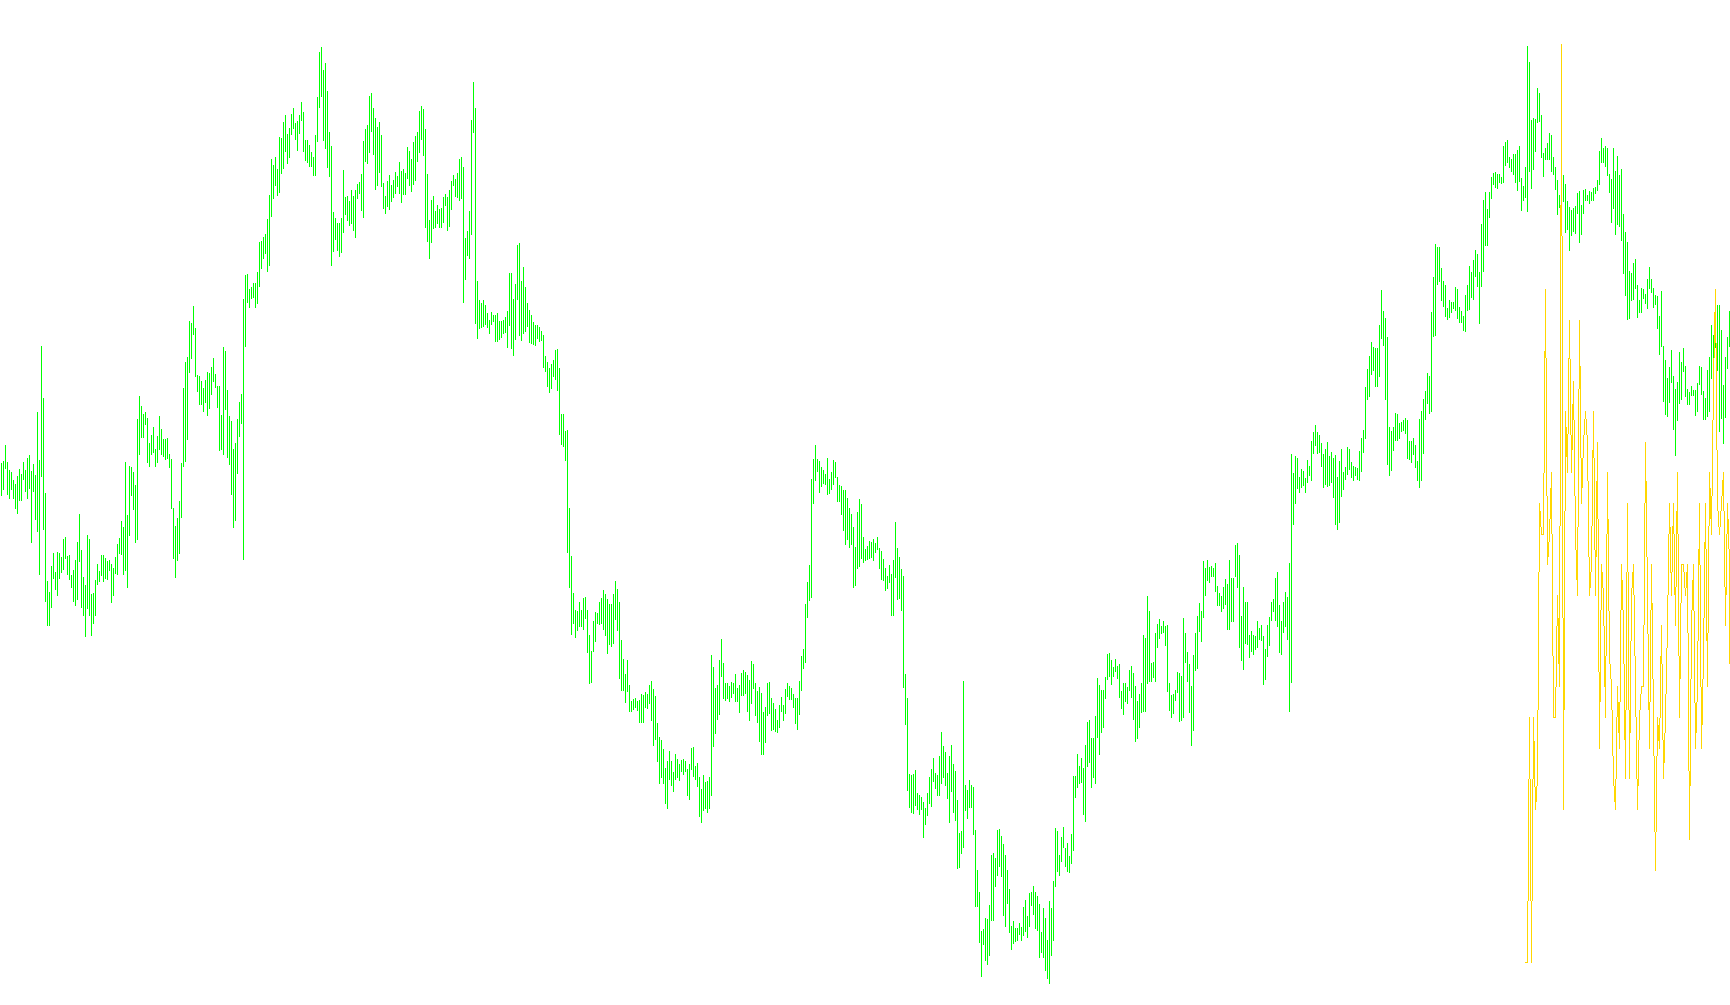
This technical indicator is designed to provide traders with a visual representation of market "density" or frequency based on specific price momentum levels. Instead of showing standard price movements, it analyzes how often the market settles into certain zones over a specific period.
Core Logic and Functionality
The script operates by scanning the most recent historical data to determine where price action is most concentrated. Here is a breakdown of how it processes this information:
- Momentum Tracking: The tool utilizes a Stochastic calculation, which is a common way to measure whether a market is overbought, oversold, or moving with significant strength.
- Frequency Counting: Rather than simply plotting the raw value of that momentum, the script acts as a "counter." It looks back at a user-defined number of recent candles (the "channel size") and records how many times the momentum reaches specific numerical levels.
- Data Aggregation: It creates a distribution map. By counting these occurrences, it identifies which areas are being visited most frequently by the price action. For example, if the momentum value hits a certain level multiple times in a short period, that "bucket" receives a higher score.
- Visual Output: The final result is displayed as a separate line graph. This line represents the distribution of these counts. It allows a trader to see at a glance where the most "active" zones are located.
How it helps the user
Instead of looking at volatile price swings, this indicator helps smooth out the "noise" of the market. By visualizing the frequency of momentum levels, it highlights areas of high activity. If certain levels show a higher count, it suggests those are significant zones where the market is spending a considerable amount of time, providing a different perspective on market sentiment and potential support or resistance dynamics.
/*-----------------------------+
|			       |
| Shared by www.Aptrafx.com    |
|			       |
+------------------------------*/

//+------------------------------------------------------------------+
//|                                                          PDF.mq4 |
//|                         Copyright © 2006, Luis Guilherme Damiani |
//|                                      http://www.damianifx.com.br |
//+------------------------------------------------------------------+
#property copyright "Copyright © 2006, Luis Guilherme Damiani"
#property link      "http://www.damianifx.com.br"

#property indicator_separate_window
#property indicator_buffers 1
#property indicator_color1 MediumSeaGreen

double pdf[];
//---- input parameters
extern int       ch_size=20;
//extern int limit_value=0;
//+------------------------------------------------------------------+
//| Custom indicator initialization function                         |
//+------------------------------------------------------------------+
int init()
  {

  SetIndexStyle(0,DRAW_LINE);
   SetIndexBuffer(0,pdf);

//----
   return(0);
  }
//+------------------------------------------------------------------+
//| Custom indicator deinitialization function                       |
//+------------------------------------------------------------------+
int deinit()
  {
//----

//----
   return(0);
  }
//+------------------------------------------------------------------+
//| Custom indicator iteration function                              |
//+------------------------------------------------------------------+
int start()
  {

//----
//---- indicators
   int counter[100];
   int totBars=Bars;
   int value=0;

   int    counted_bars=IndicatorCounted();

      if(counted_bars<0) return(-1);
   ArrayInitialize(counter,0);
   for(int i =Bars-1-ch_size;i>=0;i--)
   {
   value=MathCeil(iStochastic(NULL,0,ch_size, 2,1,MODE_SMA,0,MODE_MAIN,i));
   counter[100-value]=counter[100-value]+1;
   //if(counter[100-value]>limit_value && limit_value!=0)counter[100-value]=limit_value;
   }
   pdf[0]=0;
   for(i=100;i>0;i--)
   {
      pdf[i]=counter[i];

     // Print(pdf[i]);
   }
//----
   return(0);
  }
//+------------------------------------------------------------------+
Comments