PercentR - PCR1_001
Download script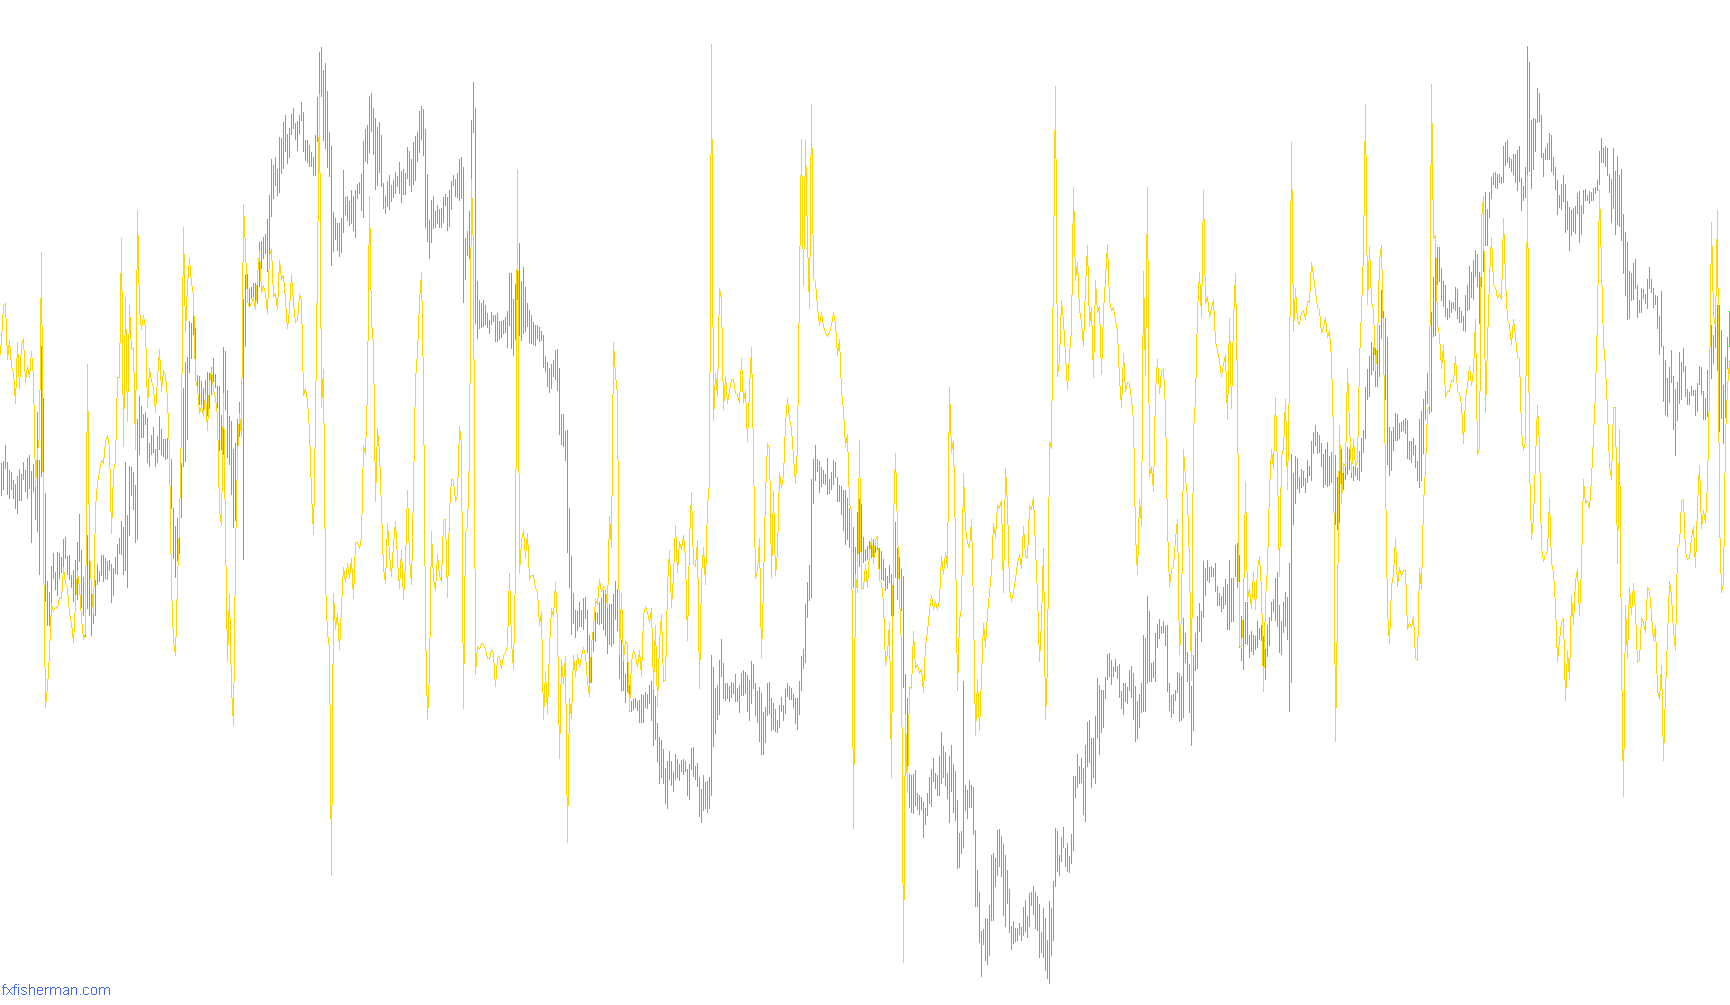
This tool is designed to help traders visualize the relative position of current market prices within a specific recent price range. Instead of looking at raw price numbers, it translates market movement into a percentage, allowing you to see how "expensive" or "cheap" an asset is compared to its recent highs and lows.
How the Logic Works
The indicator operates by scanning a defined window of historical data (the "lookback period"). For every point on your chart, it performs three primary actions:
- Identifying Boundaries: It looks back over a set number of bars to find the highest price reached (the "ceiling") and the lowest price reached (the "floor").
- Pinpointing Current Value: It identifies the current closing price of the market at that specific moment.
- Calculating the Percentage: It calculates where that closing price sits between the ceiling and the floor.
Visualizing the Results
The final output is displayed as a line on a separate window below your main chart, ranging from 0% to 100%:
- Near 100%: This indicates that the current price is very close to the recent high. The market is trading near its "ceiling," suggesting it may be reaching a point of exhaustion or overextension.
- Near 0%: This indicates that the current price is very close to the recent low. The market is trading near its "floor," suggesting it might be at a significant bottom relative to the recent period.
- Middle Range (50%): If the line sits in the middle, the price is currently positioned halfway between the recent high and low.
Key Purpose for Traders
The goal of this logic is to provide a "normalized" view of the market. Because different assets have different price points (for example, a stock trading at $10 versus one trading at $1,000), looking at raw prices can be confusing. By converting these movements into a percentage, this tool allows you to see the momentum and relative positioning consistently across any asset or timeframe.
//+------------------------------------------------------------------+
//|                PercentR - PCR.mq4                                |
//|                Copyright © 2006  Scorpion@fxfisherman.com        |
//+------------------------------------------------------------------+
#property copyright "FxFisherman.com"
#property link      "http://www.fxfisherman.com"

#property indicator_separate_window
#property indicator_buffers 1
#property indicator_color1 Lime
#property indicator_level1 80
#property indicator_level2 20

extern int HL_Period=20;
extern int Shift_Bars=0;
extern int Bars_Count= 1000;

//---- buffers
double v1[];
double val1;

int init()
  {

   IndicatorBuffers(1);

   SetIndexStyle(0,DRAW_LINE,STYLE_SOLID,1);
   SetIndexDrawBegin(0,-1);
   SetIndexBuffer(0, v1);
   SetIndexLabel(0,"PCR");

   watermark();

   return(0);
  }

int start()
 {
  int i;
  int shift;
  double h, l, p;
  int counted_bars = IndicatorCounted();
  if (counted_bars > 0) counted_bars--;
  if (Bars_Count > 0 && Bars_Count <= Bars)
  {
    i = Bars_Count - counted_bars;
  }else{
    i = Bars - counted_bars;
  }

  while(i>=0)
   {
    shift = i + Shift_Bars;
    h = High[Highest(Symbol(), Period(), MODE_HIGH, HL_Period, shift + 1)];
    l = Low[Lowest(Symbol(), Period(), MODE_LOW, HL_Period, shift + 1)];
    p = Close[shift];
    if (h > 0 && p > 0 && l > 0)
    {
        v1[i] = ((p-l)/(h-l))*100;
//      v1[i] = ((h-p)/(h-l))*100;
    }
    i--;
   }
  return(0);
 }

//+------------------------------------------------------------------+

void watermark()
  {
   ObjectCreate("fxfisherman", OBJ_LABEL, 0, 0, 0);
   ObjectSetText("fxfisherman", "fxfisherman.com", 11, "Lucida Handwriting", RoyalBlue);
   ObjectSet("fxfisherman", OBJPROP_CORNER, 2);
   ObjectSet("fxfisherman", OBJPROP_XDISTANCE, 5);
   ObjectSet("fxfisherman", OBJPROP_YDISTANCE, 10);
   return(0);
  }
Comments