PerkyAsctrend1_v3
Download script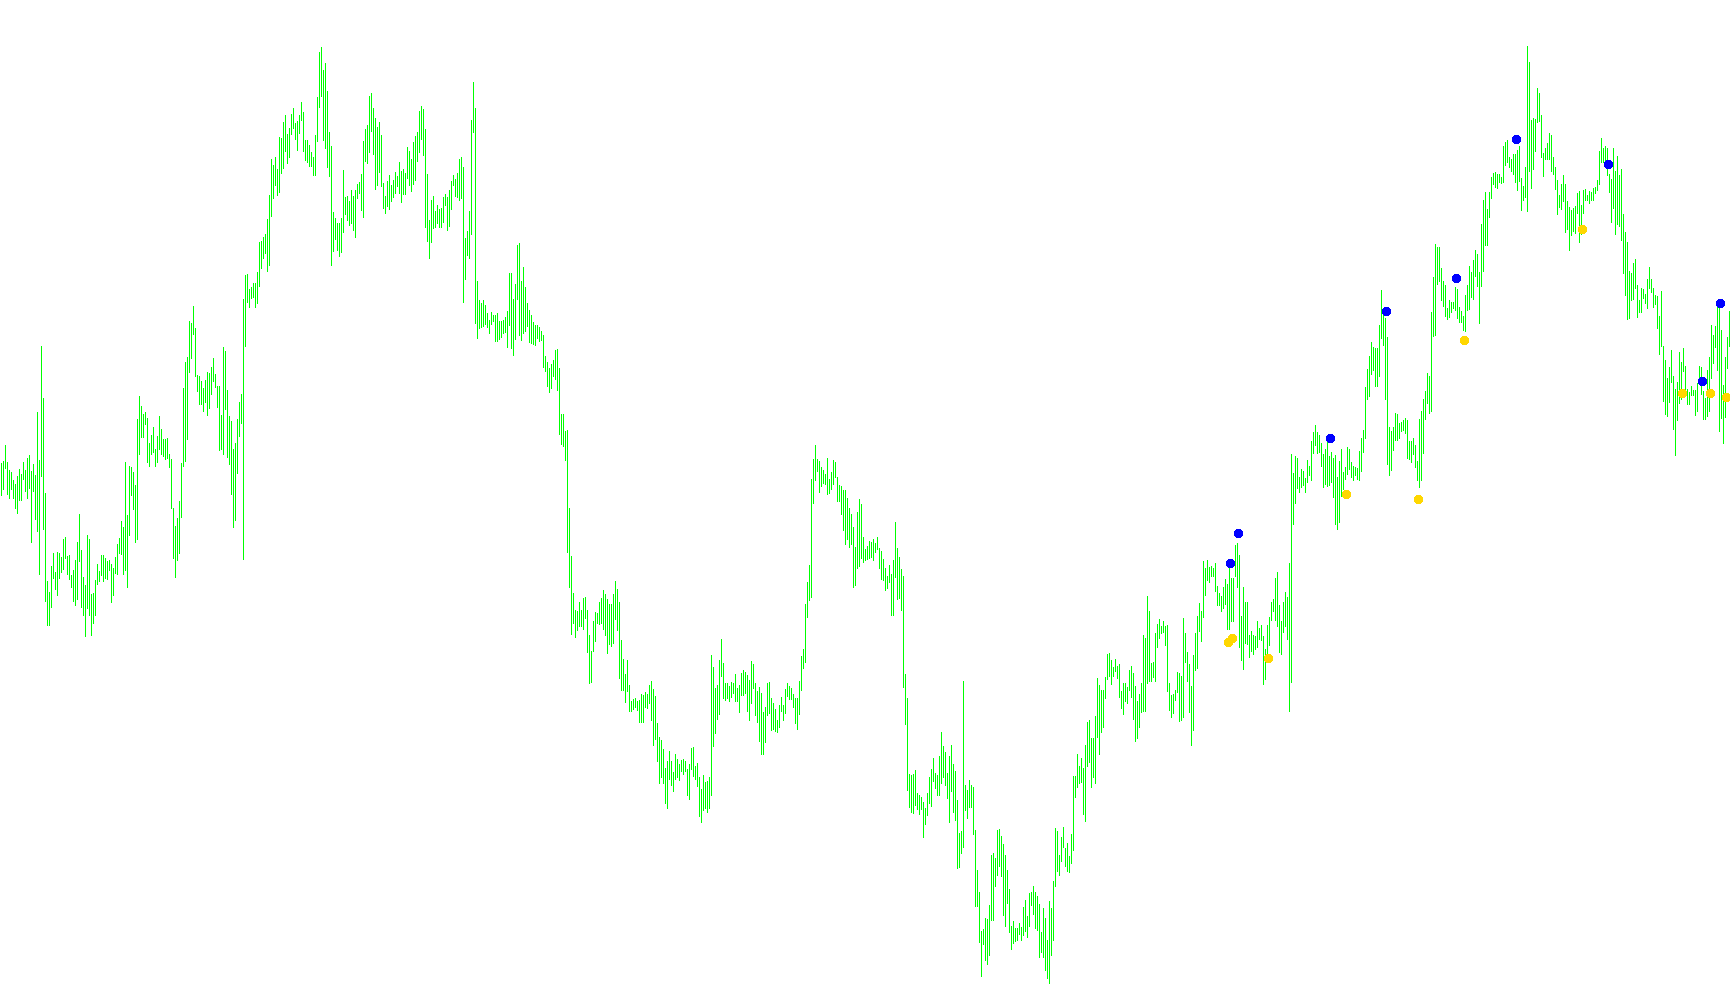
The ASCtrend indicator is designed to identify specific trend reversals by analyzing price action volatility and momentum. Rather than relying on simple moving averages, it looks for "breakout" behaviors where the price moves significantly faster or further than its recent historical average.
Here is a breakdown of how the logic works in plain English:
1. Volatility and Range Assessment
The script constantly monitors the most recent price history (specifically looking back at blocks of 10 candles). It calculates an Average Range, which represents the typical "swing" size of the market during that period. This baseline is used as a benchmark to determine what constitutes a normal move versus an unusual, high-intensity move.
2. Identifying High-Intensity Moves
The core logic searches for two specific types of price behaviors:
- Gap/Expansion Detection: It looks for instances where the difference between a candle's opening and closing price is significantly larger than the established average range.
- Momentum Acceleration: It checks for rapid price shifts over short intervals to see if the market is actively "pushing" in a specific direction with force.
3. Dynamic Adjustment (Risk Factor)
The script includes a Risk setting that allows the user to customize these thresholds. By adjusting this, you can make the indicator more sensitive (detecting smaller moves) or more conservative (waiting for larger, more significant price spikes before giving a signal).
4. Signal Filtering and Execution
Once a high-intensity move is detected, the script uses a secondary calculation to determine if the market has reached an "extreme" state (similar to overbought or oversold conditions). It then performs a "waiting" logic:
- The Buy Signal: If the price shows a significant downward exhaustion followed by a breakout toward the upside, it triggers a Buy alert.
- The Sell Signal: If the price shows significant upward exhaustion followed by a breakdown toward the downside, it triggers a Sell alert.
5. Visual and Audible Feedback
To keep the trader informed in real-time:
- On-Chart Arrows: The script places visual markers on the chart to highlight exactly where these trend shifts were identified.
- Real-Time Alerts: When a new signal is generated on the most recent price bars, the script sends an immediate "Alert" notification, informing you of the current trade direction (Buy or Sell) for the specific currency pair or asset being viewed.
Summary for the User
Essentially, this tool filters out the "noise" of daily market fluctuations and only alerts you when it sees a mathematically significant surge in price momentum that deviates from the recent norm. It is designed to capture trend shifts by identifying when the market "breaks" its previous behavior.
//+------------------------------------------------------------------+
//|                                                ASCtrend.mq4 |
//|                      Copyright © 2005, MetaQuotes Software Corp. |
//|                                        http://www.metaquotes.net |
//+------------------------------------------------------------------+
#property copyright "Copyright © 2005, MetaQuotes Software Corp."
#property link      "http://www.metaquotes.net"
#property indicator_chart_window
#property indicator_buffers 2
#property indicator_color1 Aqua
#property indicator_color2 Magenta

extern int RISK=4;
extern int AllBars=250;
int up=0,dn=0;
double val1buffer[];
double val2buffer[];
//+------------------------------------------------------------------+
//| Custom indicator initialization function                         |
//+------------------------------------------------------------------+
int init()
  {
//---- indicators
      SetIndexStyle(0,DRAW_ARROW,EMPTY);
      SetIndexArrow(0,108);
      SetIndexBuffer(0, val1buffer);

      SetIndexStyle(1,DRAW_ARROW,EMPTY);
      SetIndexArrow(1,108);
      SetIndexBuffer(1, val2buffer);
      return(0);
  }
//+------------------------------------------------------------------+
//| Custom indicator deinitialization function                       |
//+------------------------------------------------------------------+
int deinit()
   {
     return(0);
   }
//+------------------------------------------------------------------+
//| Custom indicator iteration function                              |
//+------------------------------------------------------------------+
// int    counted_bars=IndicatorCounted();

int start()
{

   double value2;
   double value3;
   double value10=10;
   double value11;
   double x1=70;
   double x2=30;
   int TrueCount;
   int counter;
   int MRO1;
   int MRO2;
   int i1;
   double Range;
   double AvgRange;
   double val1;
   double val2;
   double Table_value2[500][2];
   int counted_bars=IndicatorCounted();

   value10=3+RISK*2;
   x1=67+RISK;
   x2=33-RISK;
   value11=value10;
  //----------------------------

   if(counted_bars<0) return (-1);
   if(counted_bars>0) counted_bars--;       //last bar recounted
   int i;
   int shift = Bars-counted_bars-1;
   if (shift > AllBars) shift = AllBars;

  for(i=shift; i>0; i--)
   {


      counter=i;
      Range=0;
      AvgRange=0;
      for (counter=i ;counter<=i+9;counter++)
      {
         AvgRange=AvgRange+MathAbs(High[counter]-Low[counter]);
      }
      Range=AvgRange/10;


      counter=i;
      TrueCount=0;
      while (counter<i+9 && TrueCount<1)
      {
         if (MathAbs(Open[counter]-Close[counter+1])>=Range*2.0 )
               TrueCount++;
         counter++;
      }

      if (TrueCount>=1)
            MRO1=counter ;
      else
            MRO1=-1;

      counter=i;
      TrueCount=0;
      while (counter<i+6 && TrueCount<1)
      {
           if(MathAbs(Close[counter+3]-Close[counter])>=Range*4.6)
            {TrueCount++;}
           counter++;
      }

      if(TrueCount>=1)
            MRO2=counter;
      else
            MRO2=-1;

      if (MRO1>-1)
            value11=3;
      else
            value11=value10;

      if (MRO2>-1)
            value11=4;
      else
           value11=value10;


      value2=100-MathAbs(iWPR(NULL,0,value11,i));
      Table_value2[i][0]=i;
      Table_value2[i][1]=value2;
      val1=0;
      val2=0;
      value3=0;
      //-------------------     val1
      if (value2<x2 )  //  x2 = 30
      {
         i1=1;
         while (Table_value2[i+i1][1]>=x2 && Table_value2[i+i1][1]
<=x1)
         {i1++;}

         if (Table_value2[i+i1][1]>x1)
         {
            value3=High[i]+Range*0.5;
            val1=value3;
         }
      }

      //-------------------     val2
      if ( value2>x1) // x1 = 70
      {
            i1=1;
            while (Table_value2[i+i1][1]>=x2 && Table_value2[i+i1][1]
<=x1)
            {i1++;}

            if (Table_value2[i+i1][1]< x2)
            {
               value3=Low[i]-Range*0.5;
               val2=value3;
            }
      }


      if (val2!=0 && up==0 )
      {
           val1buffer[i]= val2-1*Point;
           up=1;
           dn=0;
           if(shift<=2)
           {
            Alert (Symbol(),"Asctrend BUY ");
            }
      }
      if (val1 !=0 && dn==0)
      {

            val2buffer[i]= val1+1*Point;
            dn=1;
            up=0;
            if(shift<=2)
            {
            Alert (Symbol(),"Asctrend SELL ");
            }
       }

   }
return(0);

}
Comments