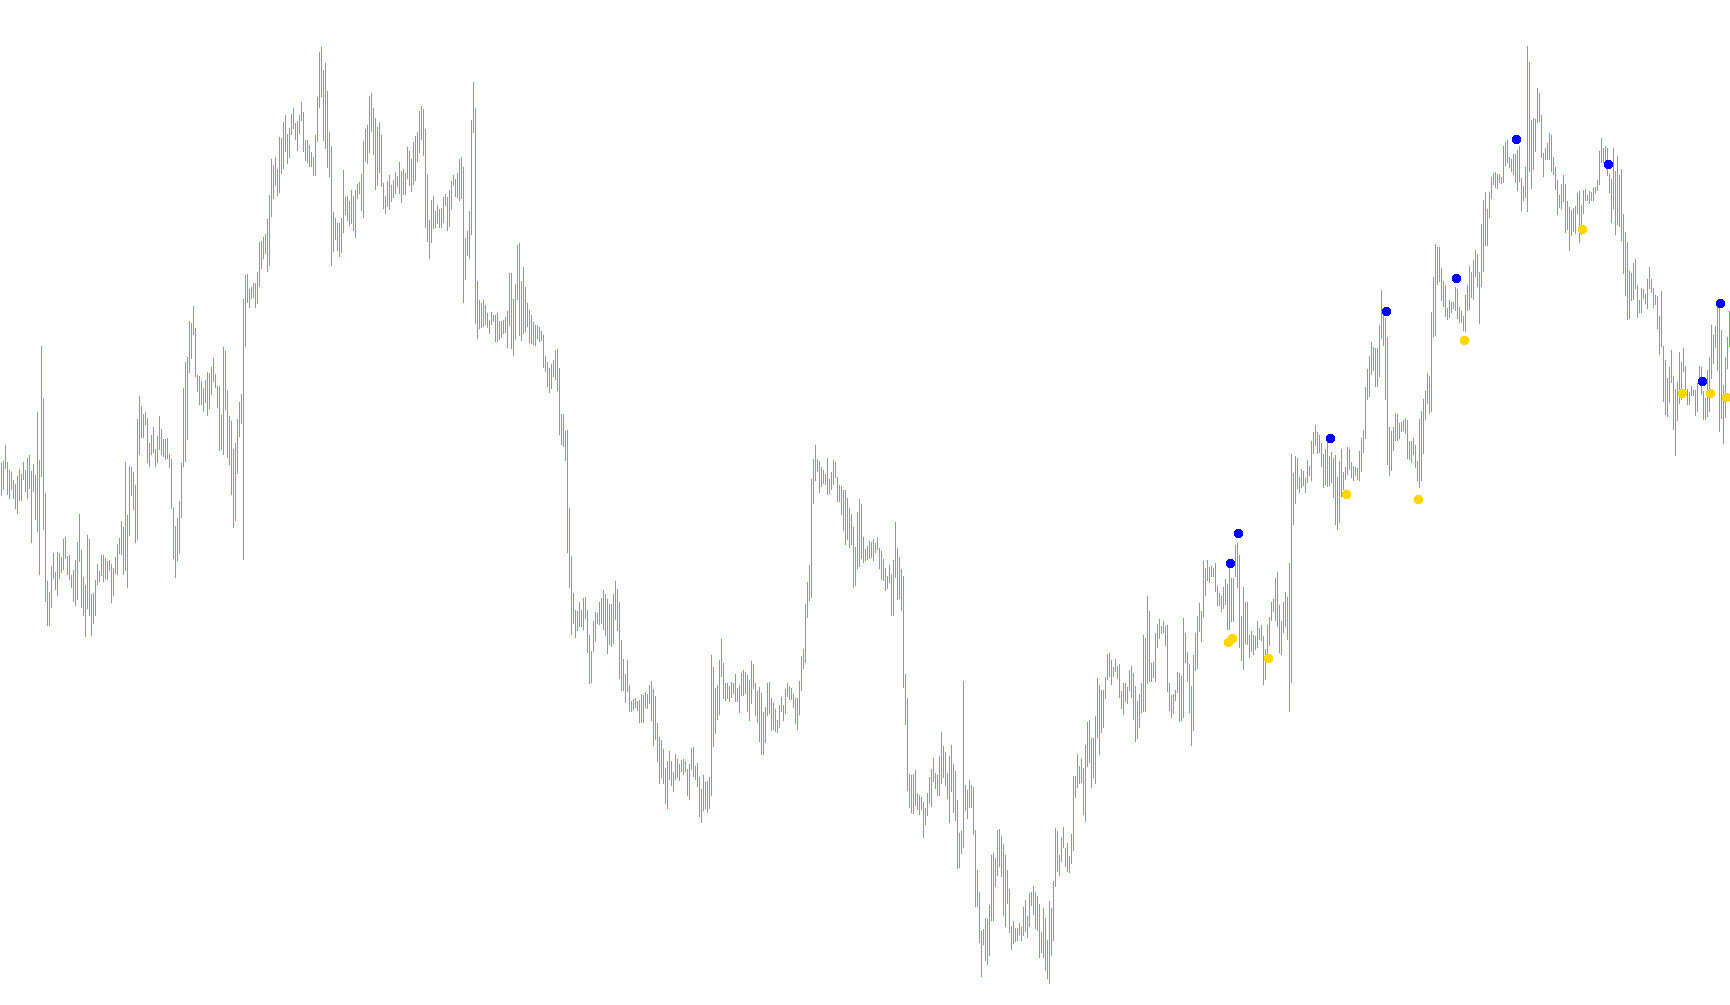
Overview
The ASCtrend indicator is designed to identify potential trend reversals in financial markets by analyzing price action and momentum. Rather than relying on a single price point, the script evaluates the relationship between recent price volatility, specific movement thresholds, and momentum oscillations to provide visual signals for potential buying and selling opportunities.
How the Logic Works
To determine when to signal a trade, the script performs several layers of analysis simultaneously:
1. Volatility and Range Calculation The tool begins by measuring the average "range" (the distance between the high and low prices) over a short window of recent candles. This establishes a baseline for what constitutes a "normal" price move in the current market environment, allowing the indicator to scale its sensitivity based on how volatile the market is at that specific moment.
2. Movement Threshold Detection The script looks for significant "breakout" movements by comparing recent price gaps against the average range calculated above. It specifically searches for:
- Large jumps between the opening and closing prices of adjacent candles.
- Significant sustained moves over several candles. If these movements are large enough relative to the current volatility, the script flags them as significant market activity.
3. Momentum Analysis (WPR Integration) The logic incorporates a momentum oscillator (Williams Percent Range). It uses the results from the movement detection phase to dynamically adjust how it interprets momentum. By blending the raw price action with this momentum data, the script attempts to filter out "noise" and focus on actual shifts in market direction.
4. Signal Generation (Buy and Sell) The final signals are produced based on the interaction between the momentum levels and the established volatility ranges:
- Sell Signals: These are triggered when the momentum drops into a specific lower boundary, provided that the price movement leading up to that point confirms an exhaustion of upward momentum.
- Buy Signals: These are triggered when the momentum rises into a specific upper boundary, provided that the preceding price action confirms a shift away from downward pressure.
User Experience and Alerts
The script provides visual cues on the chart (indicated by arrows) to show where it identifies these trend shifts. Additionally, for real-time monitoring, the indicator is programmed to trigger an audible and visual alert on your screen whenever a new Buy or Sell signal is confirmed on the current live candle.
/*-----------------------------+
|			       |
| Shared by www.Aptrafx.com    |
|			       |
+------------------------------*/

//+------------------------------------------------------------------+
//|                                                ASCtrend.mq4 |
//|                      Copyright © 2005, MetaQuotes Software Corp. |
//|                                        http://www.metaquotes.net |
//+------------------------------------------------------------------+
#property copyright "Copyright © 2005, MetaQuotes Software Corp."
#property link      "http://www.metaquotes.net"
#property indicator_chart_window
#property indicator_buffers 2
#property indicator_color1 Aqua
#property indicator_color2 Magenta

extern int RISK=4;
extern int AllBars=250;
int up=0,dn=0;
double val1buffer[];
double val2buffer[];
//+------------------------------------------------------------------+
//| Custom indicator initialization function                         |
//+------------------------------------------------------------------+
int init()
  {
//---- indicators
      SetIndexStyle(0,DRAW_ARROW,EMPTY);
      SetIndexArrow(0,108);
      SetIndexBuffer(0, val1buffer);

      SetIndexStyle(1,DRAW_ARROW,EMPTY);
      SetIndexArrow(1,108);
      SetIndexBuffer(1, val2buffer);
      return(0);
  }
//+------------------------------------------------------------------+
//| Custom indicator deinitialization function                       |
//+------------------------------------------------------------------+
int deinit()
   {
     return(0);
   }
//+------------------------------------------------------------------+
//| Custom indicator iteration function                              |
//+------------------------------------------------------------------+
// int    counted_bars=IndicatorCounted();

int start()
{

   double value2;
   double value3;
   double value10=10;
   double value11;
   double x1=70;
   double x2=30;
   int TrueCount;
   int counter;
   int MRO1;
   int MRO2;
   int i1;
   double Range;
   double AvgRange;
   double val1;
   double val2;
   double Table_value2[500][2];
   int counted_bars=IndicatorCounted();

   value10=3+RISK*2;
   x1=67+RISK;
   x2=33-RISK;
   value11=value10;
  //----------------------------

   if(counted_bars<0) return (-1);
   if(counted_bars>0) counted_bars--;       //last bar recounted
   int i;
   int shift = Bars-counted_bars-1;
   if (shift > AllBars) shift = AllBars;

  for(i=shift; i>0; i--)
   {


      counter=i;
      Range=0;
      AvgRange=0;
      for (counter=i ;counter<=i+9;counter++)
      {
         AvgRange=AvgRange+MathAbs(High[counter]-Low[counter]);
      }
      Range=AvgRange/10;


      counter=i;
      TrueCount=0;
      while (counter<i+9 && TrueCount<1)
      {
         if (MathAbs(Open[counter]-Close[counter+1])>=Range*2.0 )
               TrueCount++;
         counter++;
      }

      if (TrueCount>=1)
            MRO1=counter ;
      else
            MRO1=-1;

      counter=i;
      TrueCount=0;
      while (counter<i+6 && TrueCount<1)
      {
           if(MathAbs(Close[counter+3]-Close[counter])>=Range*4.6)
            {TrueCount++;}
           counter++;
      }

      if(TrueCount>=1)
            MRO2=counter;
      else
            MRO2=-1;

      if (MRO1>-1)
            value11=3;
      else
            value11=value10;

      if (MRO2>-1)
            value11=4;
      else
           value11=value10;


      value2=100-MathAbs(iWPR(NULL,0,value11,i));
      Table_value2[i][0]=i;
      Table_value2[i][1]=value2;
      val1=0;
      val2=0;
      value3=0;
      //-------------------     val1
      if (value2<x2 )  //  x2 = 30
      {
         i1=1;
         while (Table_value2[i+i1][1]>=x2 && Table_value2[i+i1][1]<=x1)
         {i1++;}

         if (Table_value2[i+i1][1]>x1)
         {
            value3=High[i]+Range*0.5;
            val1=value3;
         }
      }

      //-------------------     val2
      if ( value2>x1) // x1 = 70
      {
            i1=1;
            while (Table_value2[i+i1][1]>=x2 && Table_value2[i+i1][1]<=x1)
            {i1++;}

            if (Table_value2[i+i1][1]< x2)
            {
               value3=Low[i]-Range*0.5;
               val2=value3;
            }
      }


      if (val2!=0 && up==0 )
      {
           val1buffer[i]= val2-1*Point;
           up=1;
           dn=0;
           if(shift<=2)
           {
            Alert (Symbol()," ",Period(),"M  Asctrend BUY ");
            }
      }
      if (val1 !=0 && dn==0)
      {

            val2buffer[i]= val1+1*Point;
            dn=1;
            up=0;
            if(shift<=2)
            {
            Alert (Symbol()," ",Period(),"M   Asctrend SELL ");
            }
       }

   }
return(0);

}
Comments