Manage_TP v3.5 bis
Indicator

Manage_TP v3.5 bis

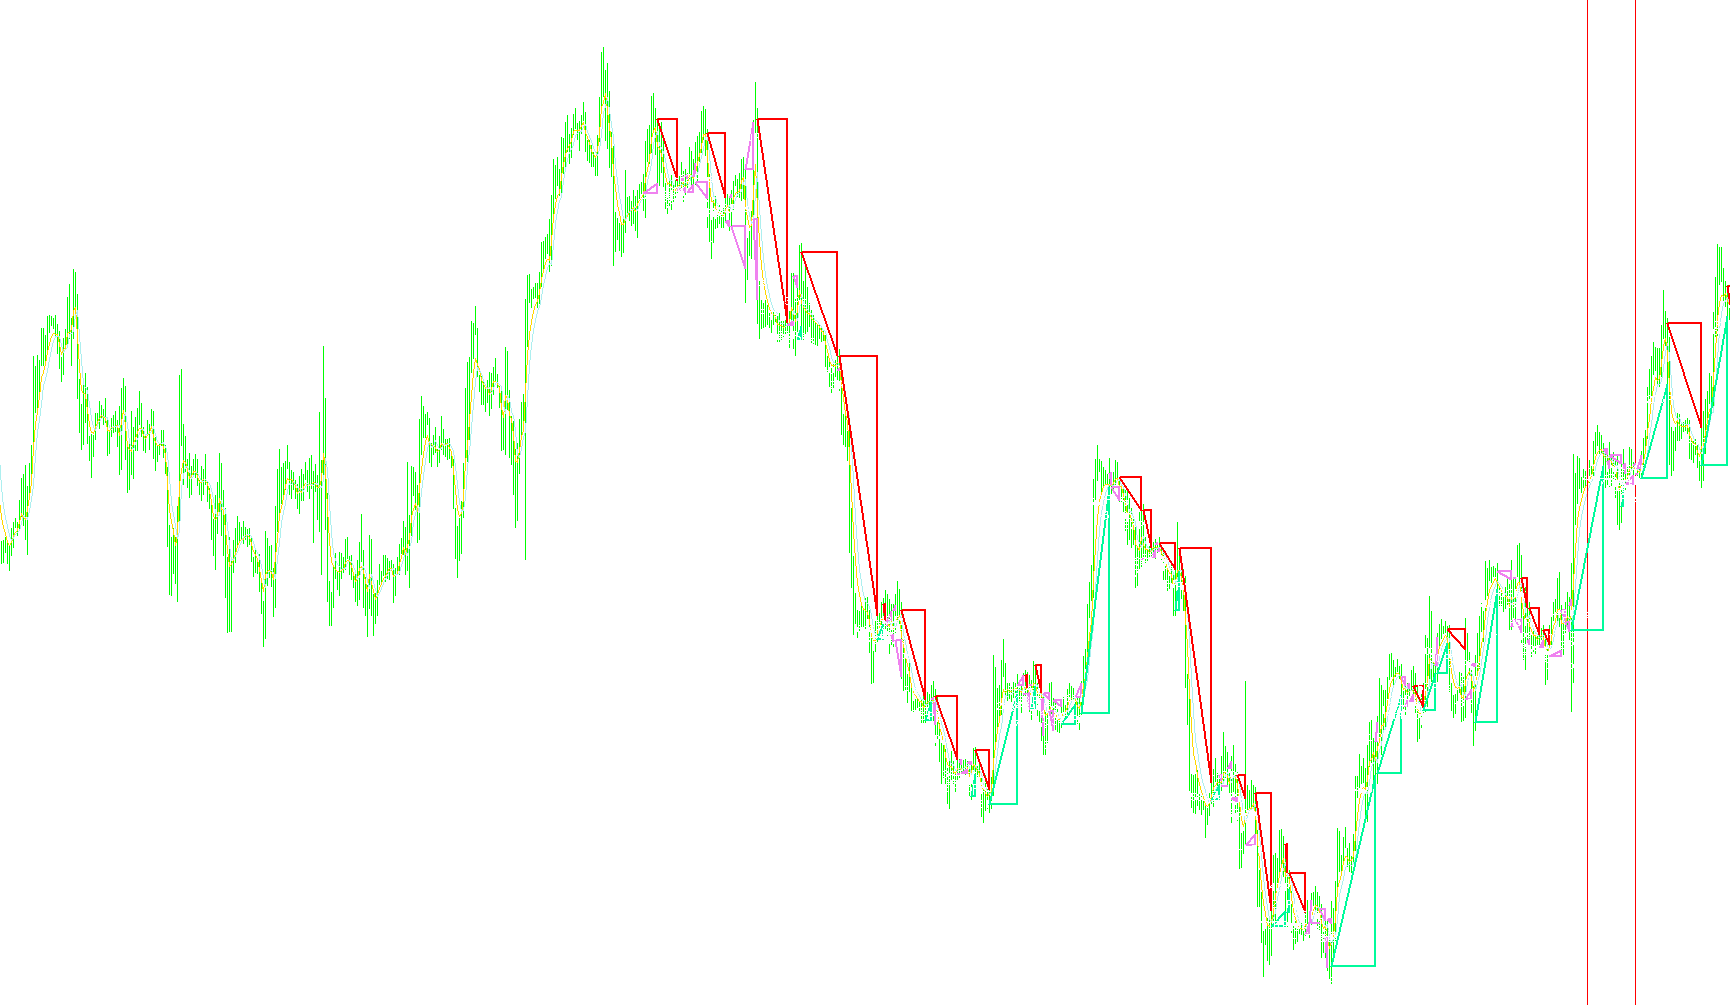
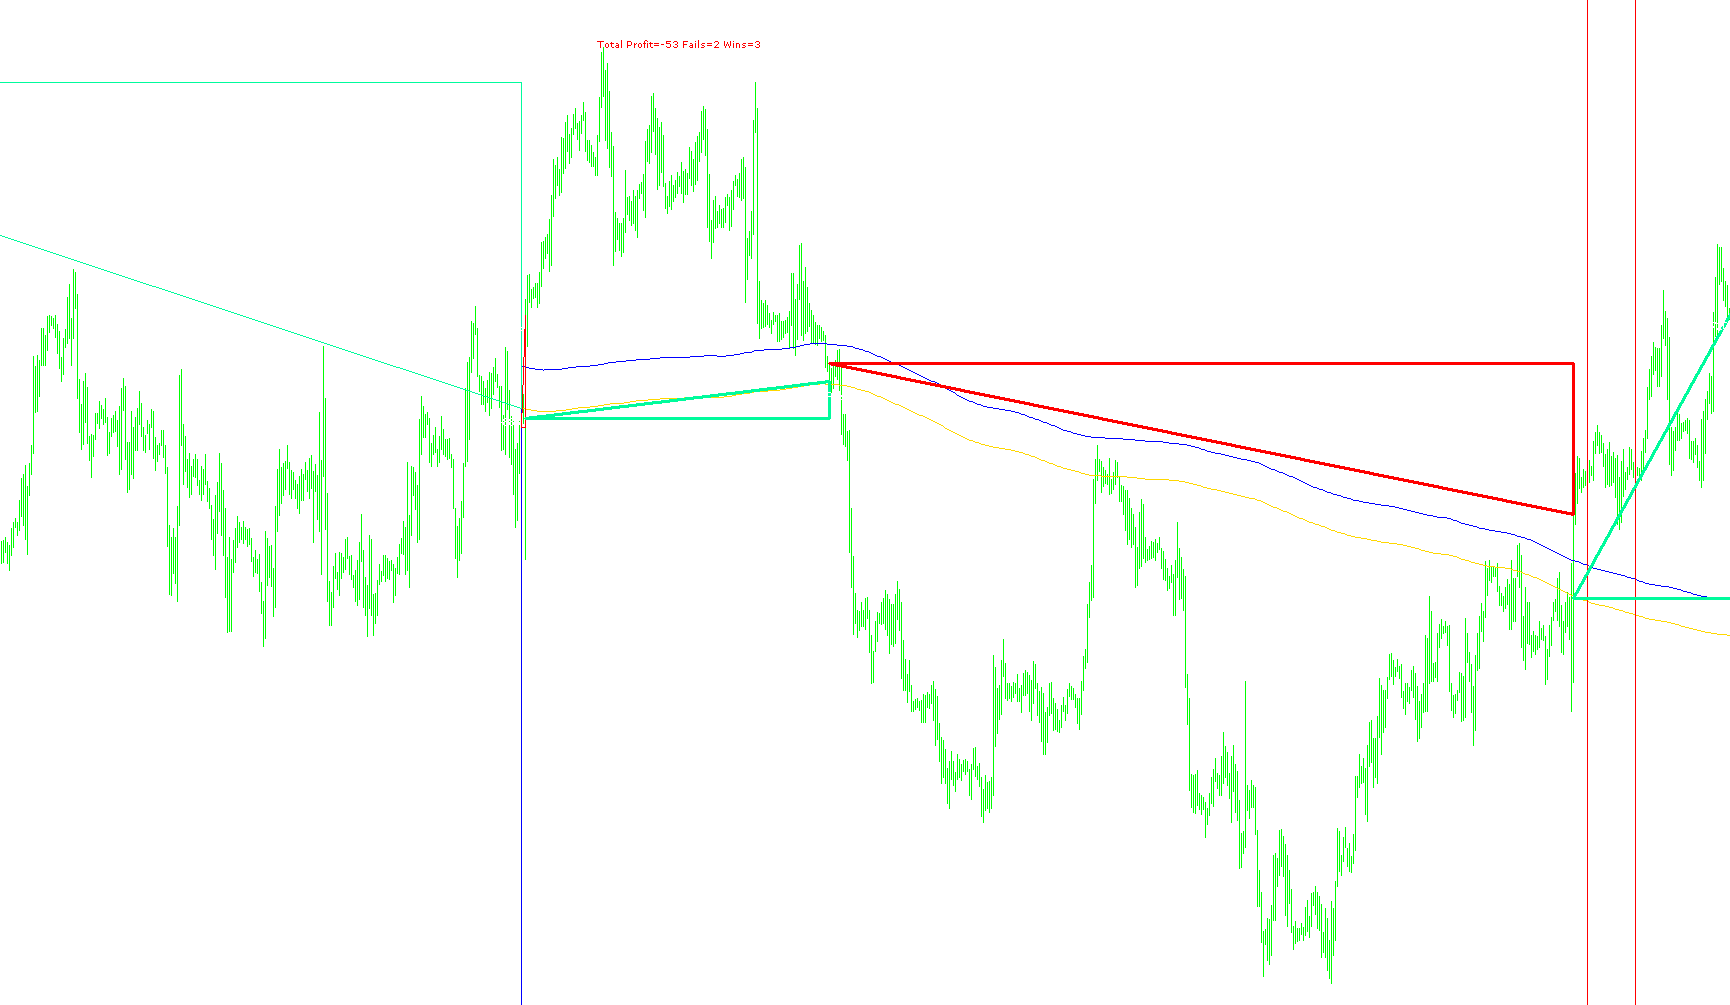
This script automates tiered profit-taking and progressive trailing stop adjustments by incrementally closing portions of a position as specific price milestones are achieved.

Manage_TP v3.5
Indicator

Manage_TP v3.5

This automated system executes incremental take-profit captures and progressively tightens stop-loss thresholds based on price progression milestones.

Manual Trendline Trader
Indicator

Manual Trendline Trader

This automated logic dynamically adjusts position sizing based on equity exposure and applies a recursive volume reduction mechanism following consecutive unprofitable trades.

MAProfit
Indicator

MAProfit

iMAiSARiRSI

This indicator identifies trend reversals by monitoring the interaction between fast and slow moving averages across multiple price points while providing automated backtesting for optimal parameter selection.

MAProfit2
Indicator

MAProfit2

iMA

This indicator quantifies the price distance between two moving averages in points to visualize momentum expansion and trend strength.

MAProfitSingle
Indicator

MAProfitSingle

iMA

This indicator simulates historical trades based on moving average price crossovers and features an automated optimization engine to identify the highest profit parameters.

MarginCalculate
Indicator

MarginCalculate

This function calculates required collateral by parsing symbol components against the account's base currency, leverage, and contract specifications.

Margin_DrawDown_Tracker
Indicator

Margin_DrawDown_Tracker

Monitors real-time portfolio health by transmitting automated alerts when account equity reaches critical drawdown thresholds or margin levels drop below predefined safety limits.

Margin_DrawDown_TrackerEZ
Indicator

Margin_DrawDown_TrackerEZ

This script tracks and displays real-time high-water marks for account margin, maximum floating losses, and peak floating profits during active trading sessions.

Indicator

Market Info

market price
Indicator

market price

This indicator visualizes real-time market prices with automated color-coded shifts that signal immediate price direction based on the previous tick.

Market Profile(1)
Indicator

Market Profile(1)

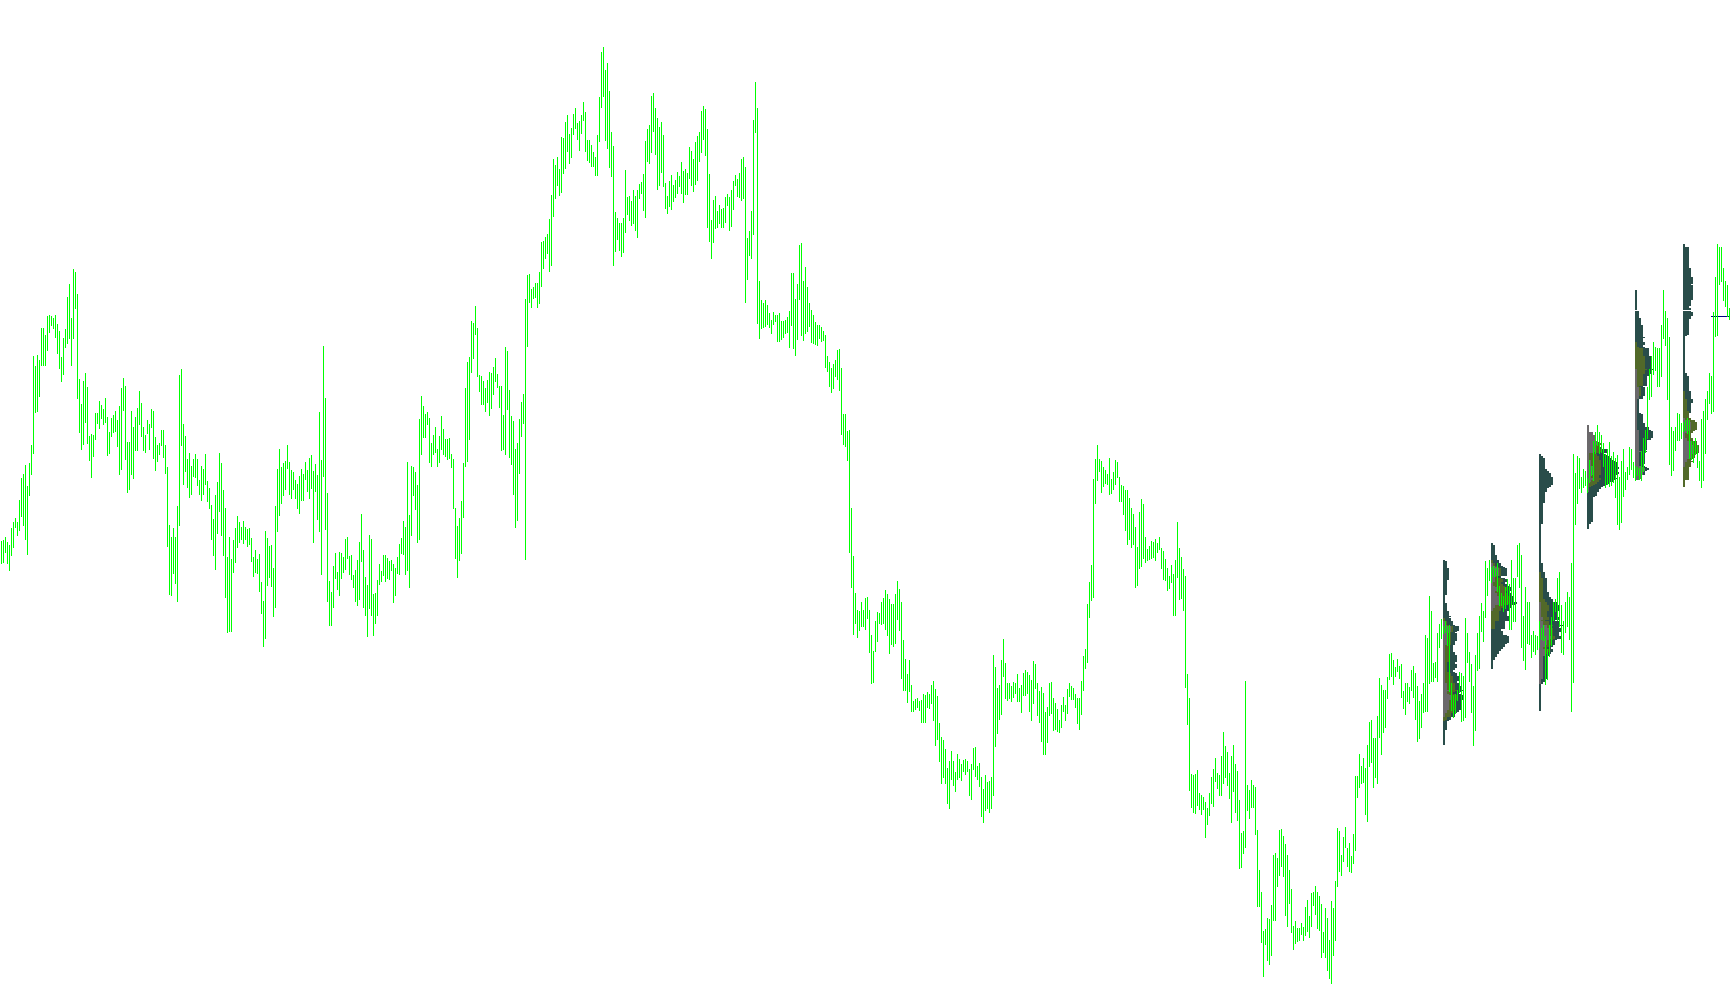
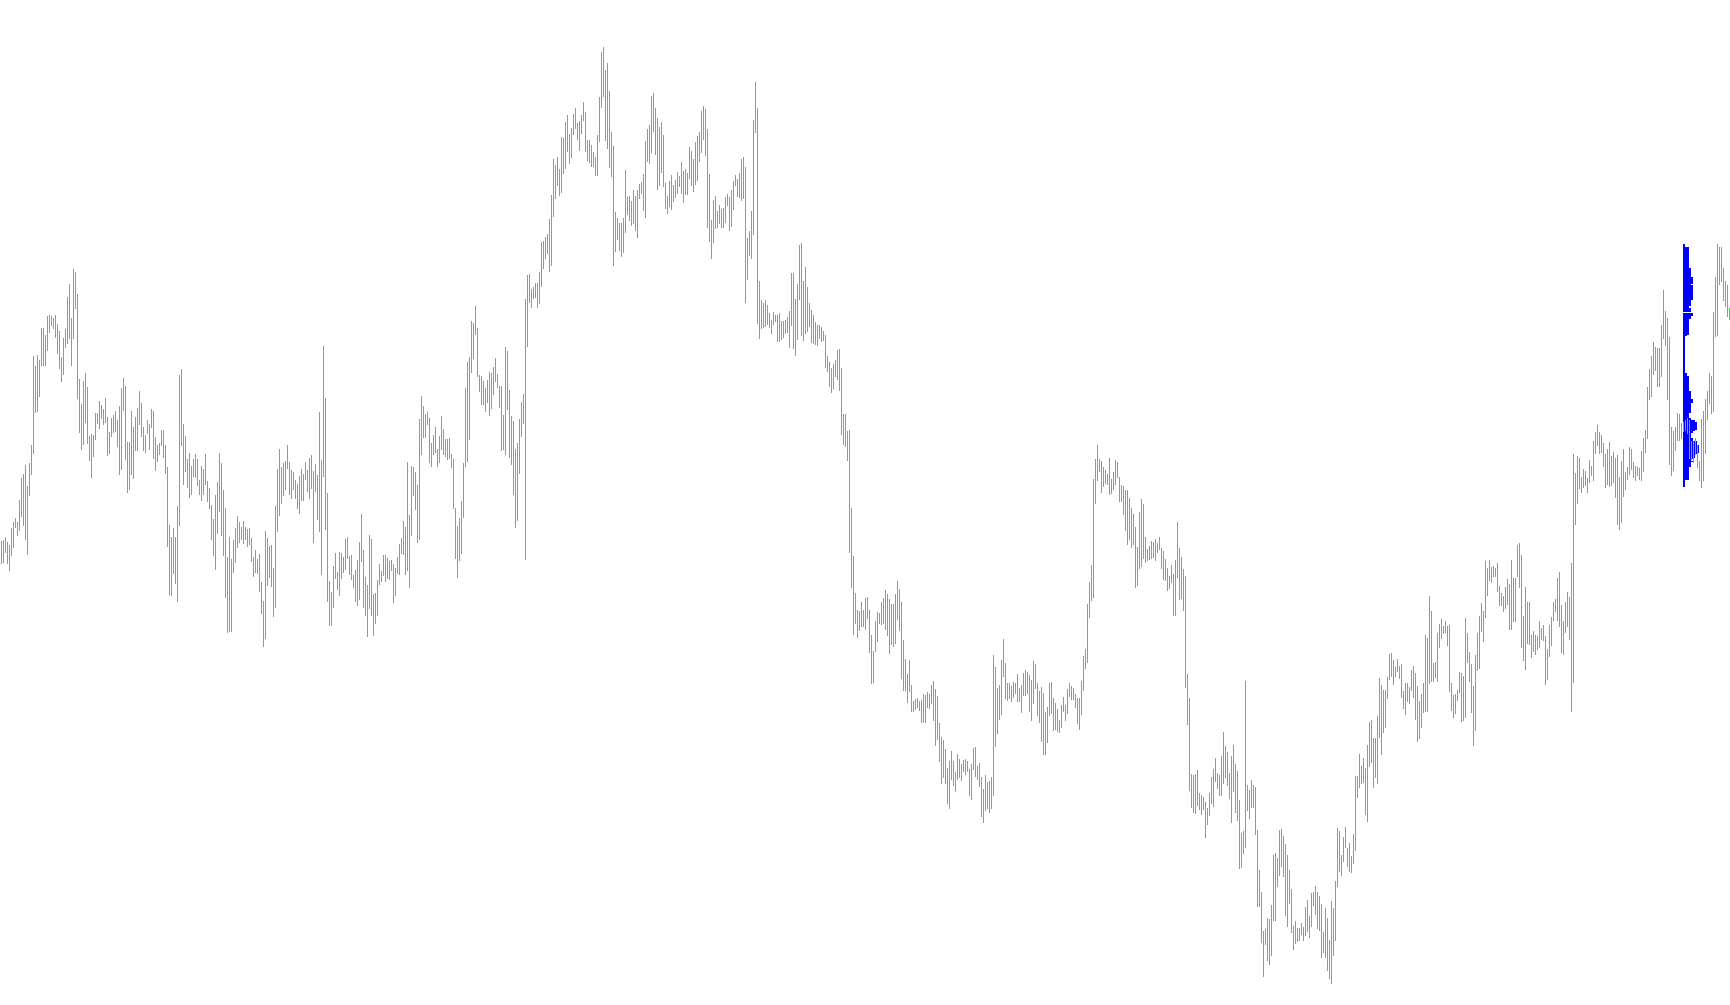
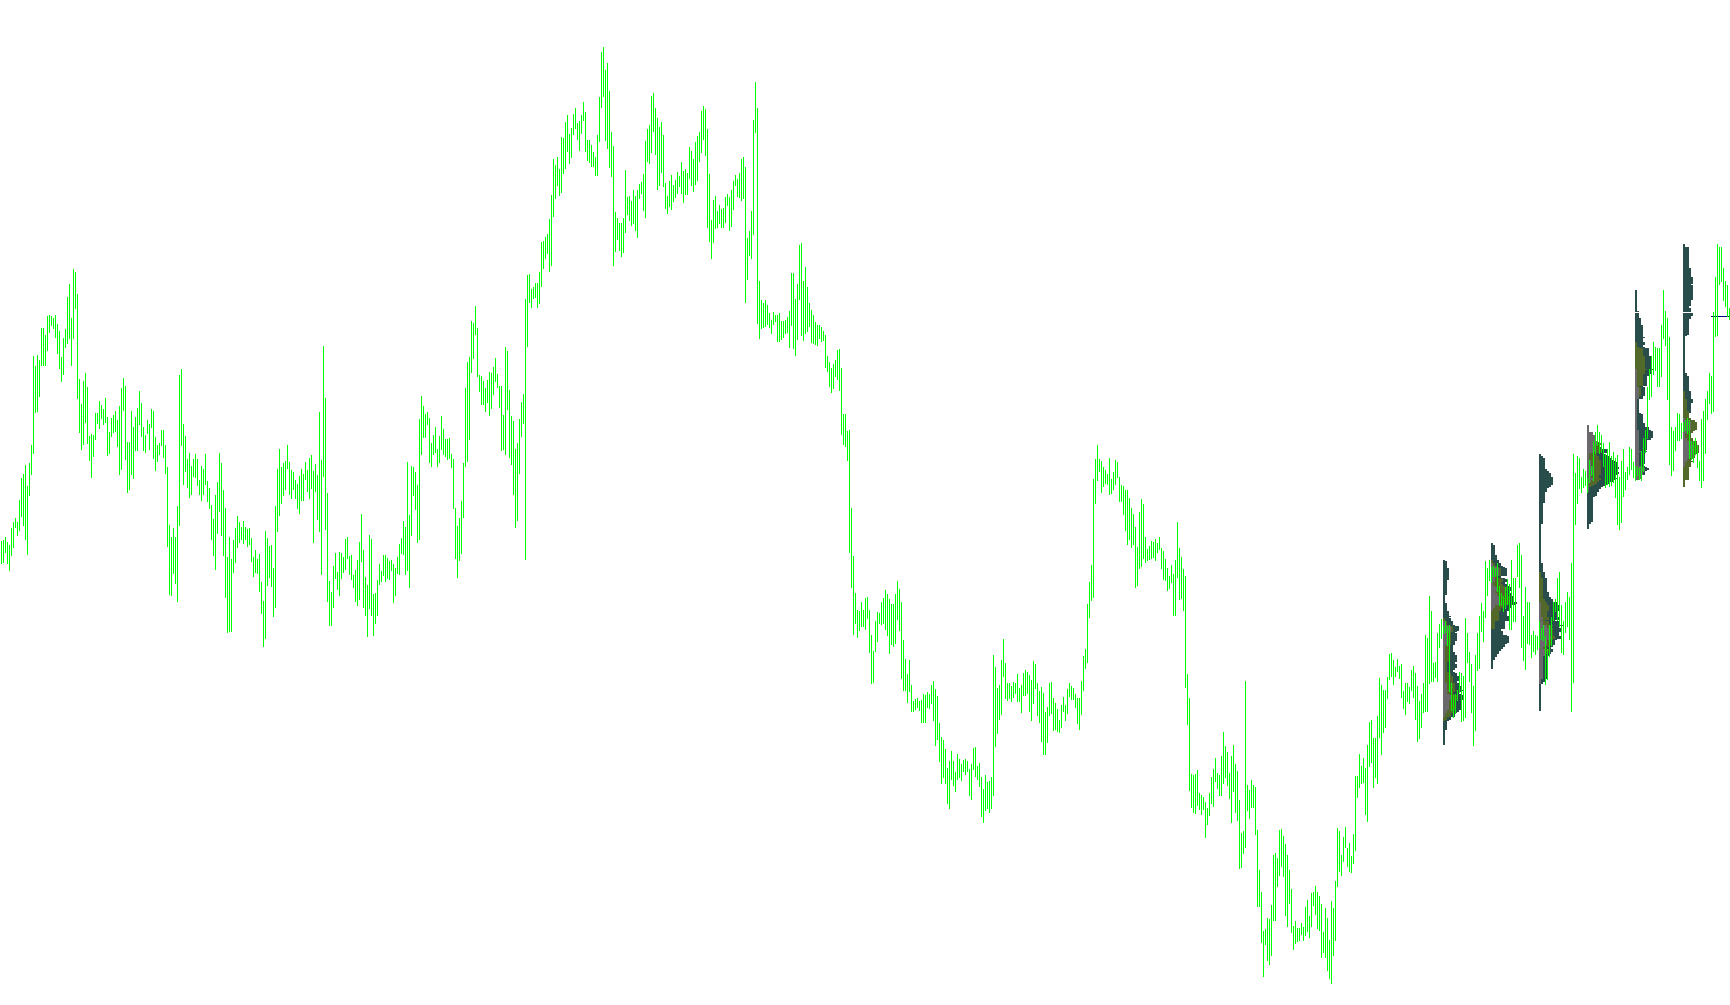
Visualizes price action density across specific geographical time zones to identify the Point of Control and volume distribution profiles.

market profile
Indicator

market profile

This indicator identifies and visualizes high-density price zones by aggregating horizontal price action across specific Asian, European, and American trading sessions.

Market Profile1
Indicator

Market Profile1

This indicator maps historical price action to visualize liquidity distribution across specific geographic sessions including Asia, Europe, and America.

market profile_v1
Indicator

market profile_v1

This indicator maps price action density into visual zones by categorizing trading volume across distinct geographical sessions and identifying the median price level for each period.

MarketHoursShade_v01
Indicator

MarketHoursShade_v01

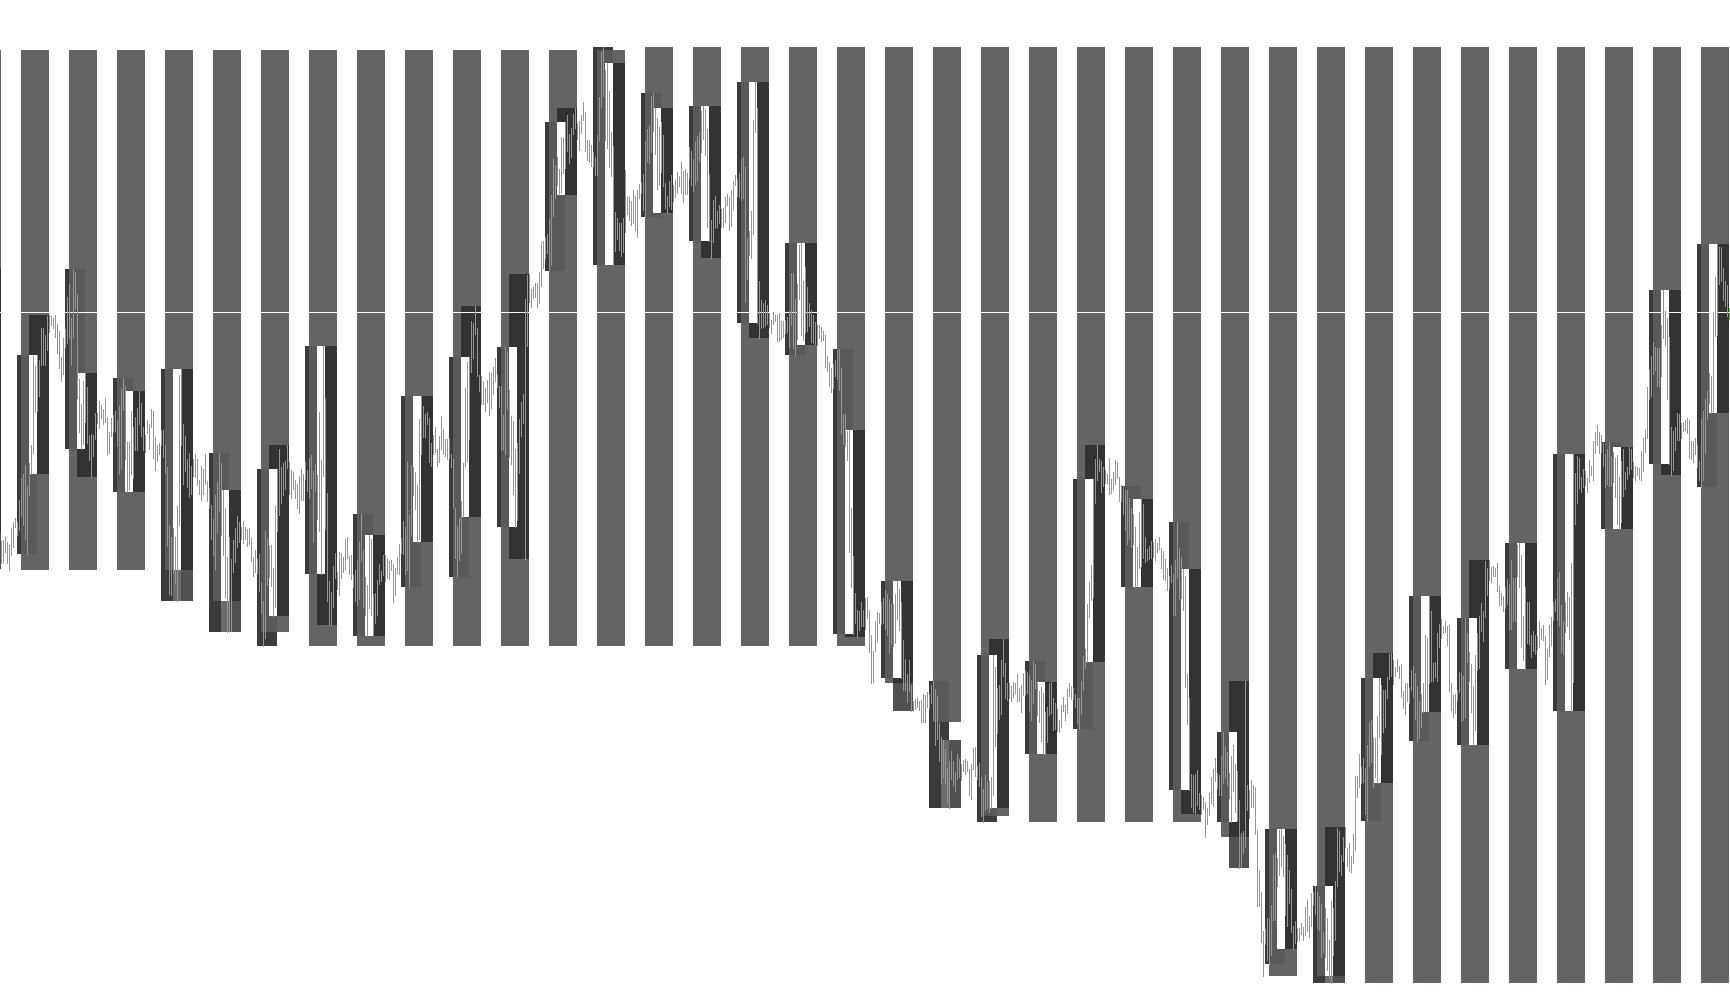
This indicator visually partitions the trading chart into distinct chronological blocks to highlight specific global market sessions using background shading.

MarketHoursShade_v01_v1
Indicator

MarketHoursShade_v01_v1

Visualizes overlapping global trading sessions by rendering high-range price boundaries across specific temporal windows.

MarketHoursShade_v01_v2
Indicator

MarketHoursShade_v01_v2

This indicator visualizes distinct global trading sessions by overlaying transparent geometric blocks that highlight period-specific price volatility and liquidity zones.

MarketInfo
Indicator

MarketInfo

An informational overlay that aggregates and displays real-time account specifications and market execution parameters directly on the chart.
marketprofile
Indicator

marketprofile

This indicator maps price action density across three distinct global trading sessions while highlighting the central value area of historical market ranges.
marketprofile_pob
Indicator

marketprofile_pob

This indicator visualizes price action density across different geographic trading sessions to identify the Point of Control (POC) and balance levels.

marketprofile_v1
Indicator

marketprofile_v1

This indicator reconstructs historical price action by mapping and visualizing horizontal volume density across specific geographical time zones to identify high-liquidity clusters.

MarketTime
Indicator

MarketTime

This indicator projects visual rectangular zones on the chart to demarcate specific high-volatility windows for Asian, European, and American trading sessions over a historical multi-day period.

Marketvision
Indicator

Marketvision

iMA

This system performs multi-dimensional statistical decomposition including linear regression, skewness, and kurtosis while monitoring real-time volatility thresholds and cross-asset momentum.

Market_Hours
Indicator

Market_Hours

Visualizes concurrent active trading windows for London, New York, Sydney, and Tokyo markets on a multi-layered temporal scale.

Market_HoursM_sw
Indicator

Market_HoursM_sw

Visualizes concurrent active trading windows for major global financial hubs by mapping specific GMT-adjusted hourly boundaries onto a secondary indicator pane.

Market_Statistics_v1
Indicator

Market_Statistics_v1

This indicator synthesizes cumulative volume-weighted average prices with multi-level standard deviation bands and a price-volume profile histogram to visualize liquidity distribution and market equilibrium.

Market_Statistics_v2
Indicator

Market_Statistics_v2

This indicator synthesizes historical price-volume data to project a vertical liquidity histogram, a cumulative Volume Weighted Average Price (VWAP), and dynamic standard deviation bands for volatility analysis.

Market_Statistics_v3
Indicator

Market_Statistics_v3

This indicator visualizes cumulative volume distribution via a horizontal histogram while concurrently plotting the Volume Weighted Average Price (VWAP) and its multi-layered standard deviation bands.

Market_Statistics_v4
Indicator

Market_Statistics_v4

This indicator reconstructs historical liquidity by generating a volume-at-price histogram and calculating multi-level standard deviation bands around the Volume Weighted Average Price (VWAP).

Market_Statistics_v4_1
Indicator

Market_Statistics_v4_1

This indicator synthesizes price action and volume data to generate a visual volume profile histogram alongside dynamic VWAP curves and multiple standard deviation bands.

Market_Statistics_v7_0
Indicator

Market_Statistics_v7_0

This indicator calculates a Volume Weighted Moving Average (VWMA) and projects multi-layered standard deviation bands to visualize price extremes relative to weighted liquidity.

Mass_Index
Indicator

Mass_Index

iMAOnArray

This indicator calculates the smoothed ratio of price range fluctuations by applying nested exponential moving averages to high-low spreads, then normalizing the result through a simple moving average multiplier.

Indicator

MasTrend

iMA
Math--System-Trader
Indicator

Math--System-Trader

This indicator calculates dynamic support and resistance levels by applying fractal dimension analysis and logarithmic scaling to identify recursive price boundaries.

Math-System
Indicator

Math-System

MATimeAuto
Indicator

MATimeAuto

iMA

The algorithm identifies bullish and bearish momentum shifts by detecting specific crossovers between a price-range adjusted SMA and a high-inertia baseline average.

Matrix1
Indicator

Matrix1

This script initializes a two-dimensional matrix of floating-point values and renders the entire data structure as a formatted string on the chart's comment area.

Matrix2
Indicator

Matrix2

This script performs multi-dimensional matrix normalization using Z-score standard deviation or midrange range scaling to prepare raw numerical data for Support Vector Machine (SVM) inputs.

Matrix3
Indicator

Matrix3

This script performs multi-dimensional array normalization using Z-score standardization and min-max range scaling to prepare training and testing datasets for Support Vector Machine architectures.

Matrix4
Indicator

Matrix4

A multi-modal data transformation engine that performs standardized normalization and range scaling on multidimensional matrices for machine learning preparation.

MatrixInd_1
Indicator

MatrixInd_1

The code implements a multi-dimensional data normalization engine designed to standardize training and testing matrices using Z-score (mean/standard deviation) or Min-Max range scaling techniques for Support Vector Machine compatibility.

MatrixInd_2
Indicator

MatrixInd_2

This indicator implements multi-dimensional matrix normalization techniques to standardize price data across multiple assets for Support Vector Machine (SVM) compatibility.

MatrixInd_3
Indicator

MatrixInd_3

The indicator extracts historical price data across multiple currency pairs to perform multi-dimensional matrix normalization using standard deviation and range-based scaling techniques.

Matrix_Solve_lib
Indicator

Matrix_Solve_lib

A comprehensive computational utility for performing advanced linear algebra operations including transposition, multiplication, matrix inversion, and determinant calculation using dynamic array resizing.

matunnel
Indicator

matunnel

A multi-buffer visual foundation designed to map and overlay three distinct price action trajectories on the main chart.

MATWO
Indicator

MATWO

iMA

This indicator quantifies the cumulative spread between Simple Moving Averages and Exponential Moving Averages across multiple time scales to visualize momentum velocity.

Indicator

Mauro_Trailing

Indicator

Mauro_Trailing_v1

MAVolumeWithJMA
Indicator

MAVolumeWithJMA

iMAOnArray

This indicator analyzes market activity by comparing real-time volume against multiple moving average types, specifically featuring a Jurik Moving Average (JMA) for ultra-smooth trend identification and a percentage-based filter level to identify high-intensity liquidity spikes.