MarketHoursShade_v01_v1
Download script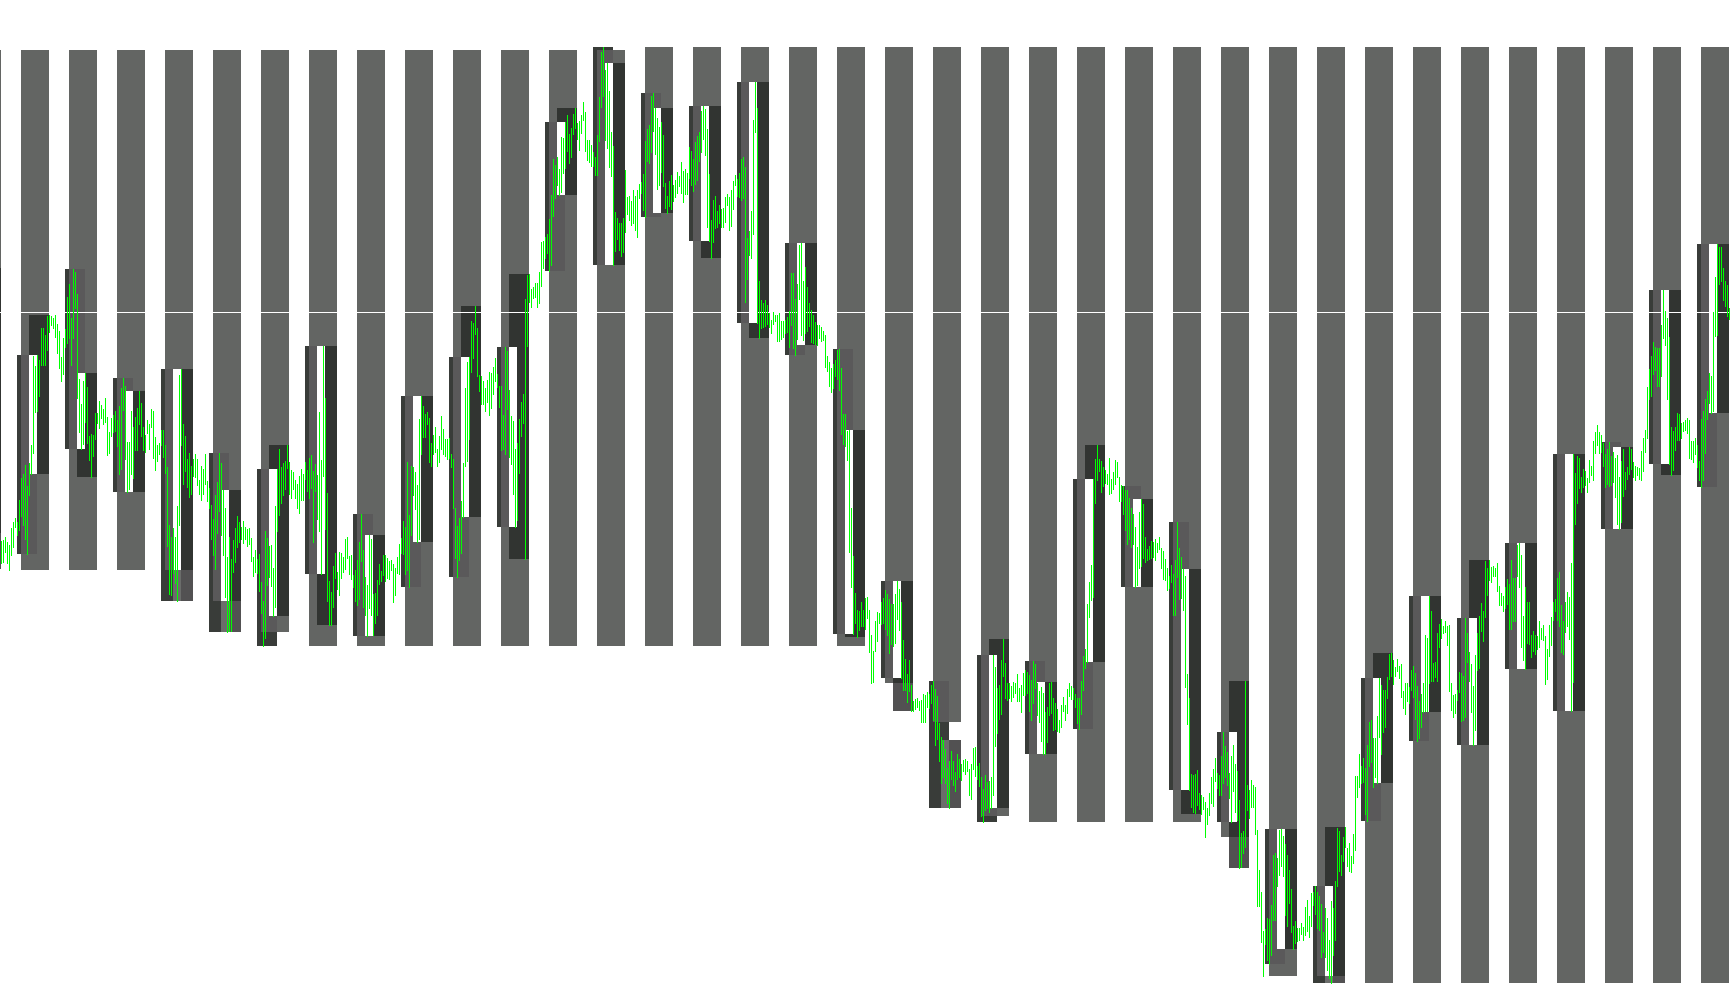
This tool is designed to enhance your trading chart by visually highlighting specific market sessions. Instead of manually tracking the opening and closing times for different global markets, this script automatically shades the background of your chart to show when key trading periods occur.
How the Logic Works
The core functionality of this script revolves around three main components:
1. Session Identification and Customization The tool allows you to define up to three distinct trading sessions (for example, European, American, and Asian/Australian markets). For each session, you can set:
- Specific Time Frames: Define the exact start and end times for each period.
- Unique Visuals: Assign different colors to each session so you can easily distinguish between them at a glance.
- Historical Depth: You can choose how many days into the past the script should project these shaded zones.
2. Automated Visual Mapping The script automatically calculates the boundaries for each session based on your inputs. It identifies the specific price points needed to draw these background boxes:
- High/Low Range Tracking: By default, the script looks at the highest and lowest prices reached during that specific time window. It then draws a rectangular "shade" that covers that entire price range, providing a clear visual of the volatility for that session.
- Background Integration: The shaded boxes are placed in the background of the chart, ensuring they remain visible without cluttering your technical indicators or price action candles.
3. Smart Calendar Logic To ensure the visual shading remains accurate over long periods, the script includes built-in logic to handle the complexities of a calendar:
- Weekend Skipping: The tool is programmed to recognize weekends, ensuring that the shaded zones don't bleed into non-trading days.
- Date Transitions: It intelligently handles month-end transitions and leap years. This ensures that if a trading session crosses over into a new month or year, the visual blocks remain aligned with the correct calendar date.
Summary for the User
In short, this tool acts as an automated "map" of the trading day. It creates a structured visual environment where you can immediately see which market is currently active and what price range that specific session has traded in, helping you better identify patterns, liquidity zones, and time-of-day trends.
//=============================================================================
//                                                MarketHoursShade_v01.mq4
//                                                     Originally by KimIV
//                                                     http://www.kimiv.ru
//
//                                                              23.11.2005
//
// 29 Nov 06: Modified by Derk Wehler to be readable.
//            Added/Changed a couple of input parameter defaults
//            No other changes.
//
//=============================================================================
#property copyright "Derk Wehler"
#property link      "none"

#property indicator_chart_window

//-------  -------------------------------
extern int    NumberOfDays = 50;
extern string s1           = "European";
extern color  Color_1      = C'60, 60, 60';
extern string Begin_1      = "07:00";
extern string End_1        = "17:00";
extern string s2           = "";
extern string s3           = "American";
extern color  Color_2      = C'80, 80, 80';
extern string Begin_2      = "13:00";
extern string End_2        = "23:00";
extern string s4           = "";
extern string s5           = "Asian/Austrailian";
extern color  Color_3      = C'100, 100, 100';
extern string Begin_3      = "23:00";
extern string End_3        = "09:00";
extern bool   HighRange    = true;


//=============================================================================
// Custom indicator initialization function
//=============================================================================
void init()
{
	DeleteObjects();
	for (int i=0; i < NumberOfDays; i++)
	{
		CreateObjects("PWT1"+i, Color_1);
		CreateObjects("PWT2"+i, Color_2);
		CreateObjects("PWT3"+i, Color_3);
	}
	Comment("");
}

//=============================================================================
// Custor indicator deinitialization function
//=============================================================================
void deinit()
{
	DeleteObjects();
	Comment("");
}

//=============================================================================
//
//=============================================================================
void CreateObjects(string no, color cl)
{
	ObjectCreate(no, OBJ_RECTANGLE, 0, 0,0, 0,0);
	ObjectSet(no, OBJPROP_STYLE, STYLE_SOLID);
	ObjectSet(no, OBJPROP_COLOR, cl);
	ObjectSet(no, OBJPROP_BACK, True);
}

//=============================================================================
//
//=============================================================================
void DeleteObjects()
{
	for (int i=0; i < NumberOfDays; i++)
	{
		ObjectDelete("PWT1"+i);
		ObjectDelete("PWT2"+i);
		ObjectDelete("PWT3"+i);
	}
}

//=============================================================================
// Custom indicator iteration function
//=============================================================================
void start()
{
	datetime dt = CurTime();

	for (int i=0; i < NumberOfDays; i++)
	{
		DrawObjects(dt, "PWT1"+i, Begin_1, End_1);
		DrawObjects(dt, "PWT2"+i, Begin_2, End_2);
		DrawObjects(dt, "PWT3"+i, Begin_3, End_3);
		dt = decDateTradeDay(dt);

		while (TimeDayOfWeek(dt) > 5)
			dt = decDateTradeDay(dt);
	}
}

//=============================================================================
//
//=============================================================================
void DrawObjects(datetime dt, string no, string tb, string te)
{
	datetime t1, t2;
	double   p1, p2;
	int      b1, b2;

	t1 = StrToTime(TimeToStr(dt, TIME_DATE) + " " + tb);
	t2 = StrToTime(TimeToStr(dt, TIME_DATE) + " " + te);
	b1 = iBarShift(NULL, 0, t1);
	b2 = iBarShift(NULL, 0, t2);
	p1 = High[Highest(NULL, 0, MODE_HIGH, b1-b2, b2)];
	p2 = Low [Lowest (NULL, 0, MODE_LOW , b1-b2, b2)];

	if (!HighRange)
	{
		p1 = 0;
		p2 = 2 * p2;
	}

	ObjectSet(no, OBJPROP_TIME1 , t1);
	ObjectSet(no, OBJPROP_PRICE1, p1);
	ObjectSet(no, OBJPROP_TIME2 , t2);
	ObjectSet(no, OBJPROP_PRICE2, p2);
}

//=============================================================================
//
//=============================================================================
datetime decDateTradeDay (datetime dt)
{
	int ty = TimeYear(dt);
	int tm = TimeMonth(dt);
	int td = TimeDay(dt);
	int th = TimeHour(dt);
	int ti = TimeMinute(dt);

	td--;
	if (td == 0)
	{
		tm--;
		if (tm == 0)
		{
			ty--;
			tm = 12;
		}
		if (tm == 1 || tm == 3 || tm == 5 || tm == 7 || tm == 8 || tm == 10 || tm == 12)
			td = 31;

		if (tm == 2)
			if (MathMod(ty, 4) == 0)
				td = 29;
			else
				td = 28;

		if (tm == 4 || tm == 6 || tm == 9 || tm == 11)
			td = 30;
	}
	return(StrToTime(ty + "." + tm + "." + td + " " + th + ":" + ti));
}
Comments