Indicator

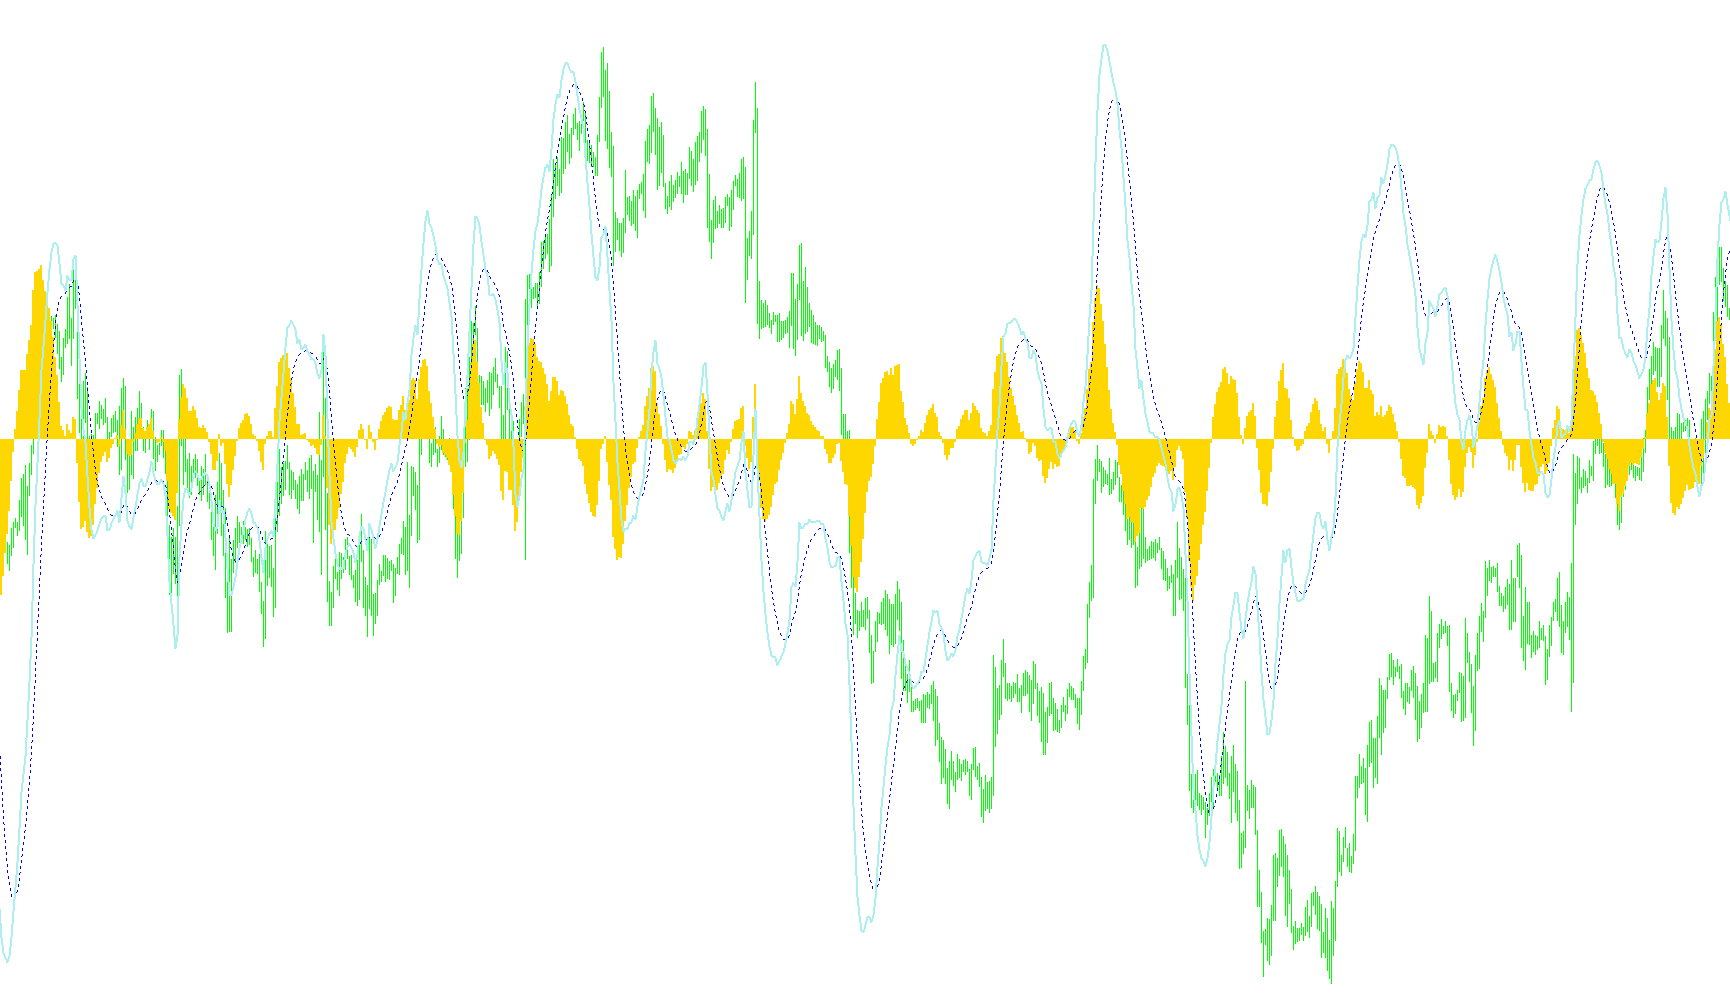
MACD_Colored_v105

iMAiMAOnArray
MACD_ColorHist_Alert  LA 5
Indicator

MACD_ColorHist_Alert LA 5

iMAiMAOnArray

This indicator calculates a modified Moving Average Convergence Divergence to visualize momentum via a dual-colored histogram and triggers real-time alerts on bullish and bearish crossover events.

MACD_ColorHist_Alert
Indicator

MACD_ColorHist_Alert

iMAiMAOnArray

This indicator visualizes MACD dynamics through multi-colored histogram bars and provides real-time notifications for zero-line crossovers, signal line intersections, and directional momentum shifts.

MACD_ColorHist_AlertEMA
Indicator

MACD_ColorHist_AlertEMA

iMAiMAOnArray

This indicator calculates MACD momentum by visualizing the variance between a fast and slow EMA, utilizing a dual-colored histogram to detect zero-line crossovers with real-time audio and email notifications.

MACD_ColorHist_AlertGGv2
Indicator

MACD_ColorHist_AlertGGv2

iMAiMAOnArray

This indicator visualizes momentum shifts by dynamically color-coding the MACD histogram based on expansion or contraction and triggers multi-channel notifications for zero-line crossovers.

MACD_ColorHist_Alert_001
Indicator

MACD_ColorHist_Alert_001

iMAiMAOnArray

This indicator visualizes moving average convergence via a multi-colored histogram while triggering real-time alerts for zero-line transitions, signal line crossovers, and momentum shifts.

MACD_ColorHist_Alert_v1
Indicator

MACD_ColorHist_Alert_v1

iMAiMAOnArray

This indicator calculates the divergence between two moving averages and visualizes the resulting momentum as a color-coded histogram that triggers real-time alerts upon zero-line crossovers.

MACD_color_new
Indicator

MACD_color_new

iMAiMAOnArray

This indicator visualizes MACD momentum by dynamically switching histogram colors based on the direction of price velocity relative to previous values.

Macd_Correct
Indicator

Macd_Correct

iMA

This indicator calculates the divergence between dual moving averages to derive a smoothed momentum histogram and signal trajectory.

MACD_correct2
Indicator

MACD_correct2

iMA

This indicator identifies trend shifts by calculating the spread between two exponential moving averages and overlaying a smoothed signal line to visualize momentum velocity.

MACD_D3X
Indicator

MACD_D3X

iMAiMAOnArray

This indicator calculates momentum dynamics by computing the differential spread between multiple moving average types—specifically Linear Weighted, Exponential, and Simple averages—across four distinct timeframes.

MACD_DEMA
Indicator

MACD_DEMA

iMAOnArray

This indicator calculates the momentum of price action by measuring the spread between two Double Exponential Moving Averages to reduce lag and heighten responsiveness.

MACD_Divergence
Indicator

MACD_Divergence

iMAiMAOnArray

This indicator identifies structural price action shifts by automatically plotting trendlines on both the price chart and the MACD subwindow to detect visual divergence between momentum and market highs/lows.

MACD_Divergence_v1
Indicator

MACD_Divergence_v1

iMAiMAOnArray

This indicator identifies structural price and momentum discrepancies by plotting concurrent trendlines on both the price chart and the MACD oscillator window.

Indicator

MACD_DotDave

iMAiMAOnArray
MACD_EMA
Indicator

MACD_EMA

iMAiMAOnArray

This indicator calculates the difference between fast and slow exponential moving averages to generate a dual-colored histogram representing momentum polarity relative to a signal SMA.

MACD_Entry
Indicator

MACD_Entry

iMACD

This indicator identifies bullish and bearish momentum shifts by detecting positive main line crossovers with negative signals and vice versa across user-defined timeframes.

MACD_H4_300_v100
Indicator

MACD_H4_300_v100

iMAiMAOnArray

This indicator quantifies the spread between a fast and slow Exponential Moving Average normalized by price points, utilizing a directional histogram to visualize momentum shifts.

MACD_Histogram
Indicator

MACD_Histogram

iMA

This indicator identifies momentum shifts by detecting classical and reverse price-to-momentum discrepancies using Moving Average Convergence Divergence peaks and troughs.

MACD_Histogram_v1
Indicator

MACD_Histogram_v1

iMA

This indicator detects and visualizes classical and reverse bullish/bearish divergences by comparing price action extremes against MACD momentum peaks and troughs.

MACD_HULL
Indicator

MACD_HULL

iMAiMAOnArray

This indicator calculates a modified momentum oscillator by determining the divergence between two independent Hull Moving Average signals and their secondary smoothed trend.

MACD_i_
Indicator

MACD_i_

iMAiMAOnArray

This script calculates the divergence between two exponential moving averages and generates a signal line and histogram to visualize momentum shifts.

MACD_lines
Indicator

MACD_lines

iMAiMAOnArray

This indicator computes the differential between two exponential moving averages and applies a simple moving average to that variance to identify momentum shifts.

MACD_LSMA
Indicator

MACD_LSMA

iMAOnArray

This indicator calculates the momentum by determining the difference between a fast and slow Least Squares Moving Average (LSMA) instead of traditional exponential averages.

MACD_LSMA_EMA
Indicator

MACD_LSMA_EMA

iMAOnArray

This indicator modifies the traditional Moving Average Convergence Divergence by substituting standard exponential averages with Least Squares Moving Averages to calculate momentum and signal lines.

MACD_OsMA_4ColorH_2LVar__mtf
Indicator

MACD_OsMA_4ColorH_2LVar__mtf

iMAiMAOnArray

This indicator calculates a dual-layered momentum signal by combining an Awesome Oscillator (OsMA) with multi-timeframe smoothing to visualize trend transitions through color-coded histogram dynamics.

MACD_OsMA_AM_.3
Indicator

MACD_OsMA_AM_.3

iMAiMAOnArray

This indicator visualizes the directional shift between a standard MACD calculation and an OsMA derivative to identify acceleration and deceleration in price velocity.

MACD_OsMA_Color
Indicator

MACD_OsMA_Color

iMACDiOsMA
Indicator

MACD_OsMA_M

iMACDiOsMA
MACD_Signals
Indicator

MACD_Signals

iMACDiMA

This indicator identifies trend reversals by normalizing MACD values against a moving average and filtering signals based on a minimum bar sequence to eliminate noise.

MACD_Signals_en
Indicator

MACD_Signals_en

iMACDiMA

This indicator filters MACD fluctuations by normalizing them against a moving average and identifying structural trend reversals based on minimum bar distance requirements.

MACD_Signal_v3
Indicator

MACD_Signal_v3

iOsMAiMAiMAOnArray
Indicator

MACD_spirit

iMACDiOsMA
MACD_TEMA
Indicator

MACD_TEMA

iMAOnArray

This indicator calculates momentum by computing the difference between two Triple Exponential Moving Averages (TEMA) and overlaying an exponential signal line to identify trend reversals.

MACD_v1
Indicator

MACD_v1

iMAiMAOnArray

This indicator calculates the instantaneous spread between two exponential moving averages to generate a histogram, overlaid with a smoothed simple moving average signal line.

MACD_v2
Indicator

MACD_v2

iMAiMAOnArray

This indicator calculates the differential between two exponential moving averages to plot a momentum histogram, overlaid with a simple moving average signal line to identify trend exhaustion and crossovers.

macd_x2MTF
Indicator

macd_x2MTF

iMACD

This indicator overlays two independent Moving Average Convergence Divergence calculations across varying timeframes to identify momentum shifts and trend crossovers.

macd_x2slopeMTF
Indicator

macd_x2slopeMTF

iMACD

This indicator calculates the rate of change between two distinct MACD settings to identify momentum acceleration by subtracting shifted historical values.

MACD_zlagmacd
Indicator

MACD_zlagmacd

iMAiMAOnArray

This indicator calculates a non-lagging MACD by applying a recursive correction formula to Fast, Slow, and Signal Exponential Moving Averages.

macd_ZZ_YZ_MDAC_ELDER_1-1000
Indicator

macd_ZZ_YZ_MDAC_ELDER_1-1000

iMAiMAOnArray

This indicator visualizes trend velocity by dynamically color-coding MACD histograms based on the synchronous correlation between price momentum and signal line trajectory.

Indicator

MACD__MTF

iMACD
MAcross
Indicator

MAcross

iMA

Identifies bullish and bearish momentum shifts by detecting specific crossover points between two variable-mode moving averages relative to local price volatility.

Indicator

MACrossIndicator

iMA
Indicator

MACrossIndicator_v1

iMA
MAcross_OpenBarSig
Indicator

MAcross_OpenBarSig

iMA

This indicator detects trend reversals by identifying precise crossover points between two distinct moving average periods while calculating price volatility to offset visual signals.

MAcross_Rsi_Sto_Macd_Fx10SetupTM
Indicator

MAcross_Rsi_Sto_Macd_Fx10SetupTM

iMACDiMAiRSIiStochastic

This indicator identifies trend reversal entries by synchronizing Moving Average crossovers with RSI strength thresholds, Stochastic oscillator positioning, and MACD signal line dynamics.

Madeleine_v2.0
Indicator

Madeleine_v2.0

This indicator renders geometric trend lines based on specific price action pivots and candle extremes, projecting diagonal trajectories at 45 and 315-degree angles.

Indicator

MADistance

iMA
Indicator

MADistancewAlerts

iMA
Indicator

MADistance_002

iMA