Market Profile1
Download script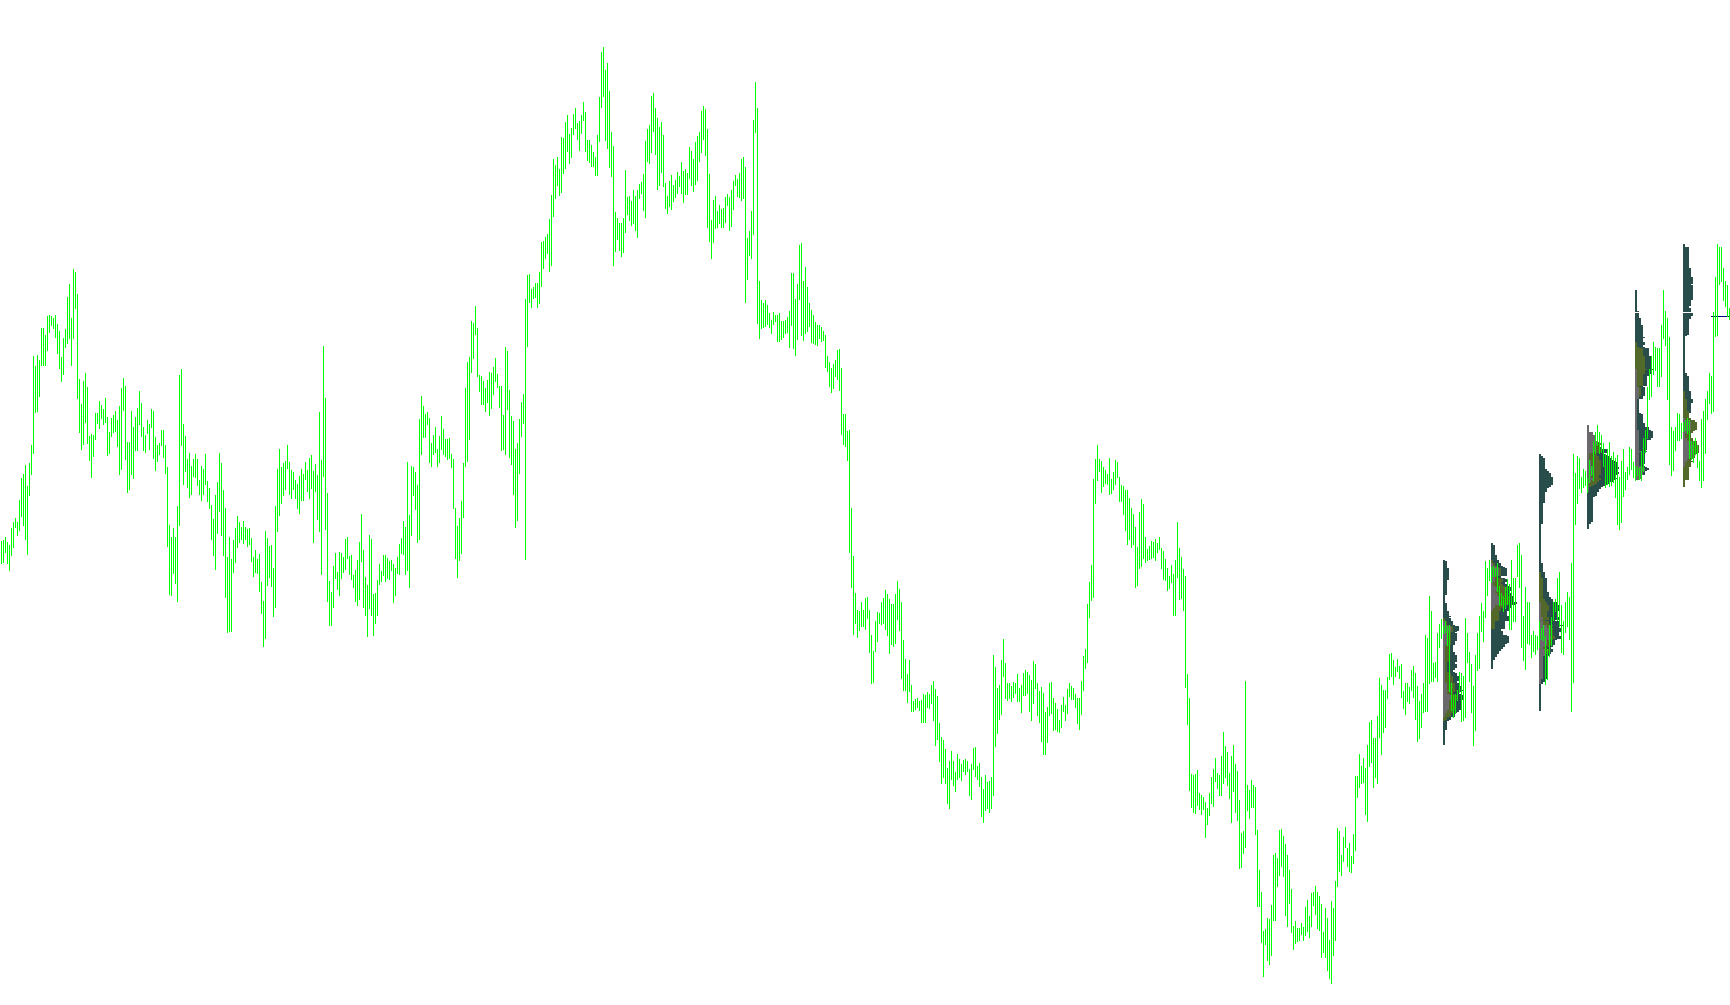
This script is designed to generate a visual "Market Profile" on your trading chart. Its primary purpose is to analyze price action history and identify specific zones of high activity, categorized by geographic trading sessions (Asia, Europe, and America). By visualizing where price spent the most time at various price levels, it helps traders identify liquidity zones, value areas, and significant historical support or resistance.
Core Functionality
1. Timeframe and Data Filtering The tool is specifically optimized for lower-to-medium timeframe charts (ranging from 15 minutes to 1 hour). It scans the historical data starting from a user-defined date (or the current day) and organizes this data into distinct daily profiles.
2. Price Level Analysis The logic works by scanning every price level within a specific trading day. It looks at the "High" and "Low" points of the day to define the boundaries. It then moves systematically through every individual price tick between those boundaries to calculate how much "activity" occurred at each specific price point.
3. Geographic Session Breakdown One of the unique features of this script is its ability to differentiate between global trading sessions based on the time of day:
- Asia: Tracks activity during early morning hours.
- Europe: Tracks activity during the middle of the trading day.
- America: Tracks activity during the later trading hours.
For every price level identified, the script calculates how many candles touched that price during each of these three specific sessions.
4. Visual Mapping (The Profile) Instead of just giving you numbers, the script draws physical rectangles on your chart:
- Session Blocks: It creates colored bars representing the volume/activity of the Asia, Europe, and America sessions at every price level. This allows you to see which session was most active at specific prices.
- The "Mediana" (Value Area): The script identifies the "Mediana"—the price level that saw the highest concentration of activity for the entire day. It marks this prominent level with a distinct solid line, highlighting the "fair value" or the center of gravity where the most trading took place.
Summary for the User
Think of this tool as a heat map for historical price action. While a standard chart shows you where the price went, this script shows you where it stayed. By breaking this down into regional sessions, it helps you visualize whether a specific price area is a "heavy" zone (where many traders are active) or a "thin" zone, providing deeper context for your technical analysis.
//+------------------------------------------------------------------+
//|                                                MarketProfile.mq4 |
//|                             Copyright © 2006, Viatcheslav Suvorov|
//+------------------------------------------------------------------+
#property copyright "Viatcheslav Suvorov"

#property indicator_chart_window

extern datetime StartDate = D'1/1/2007';
extern bool lastdayStart = true;
extern int CountProfile = 7;
extern color AziaColor=DimGray;
extern color EuropaColor=DarkOliveGreen;
extern color AmericaColor=DarkSlateGray;
extern color MedianaColor=Navy;

int fontsize=10;
int i,j;
double LastHigh,LastLow,CurPos;
bool signal;
//+------------------------------------------------------------------+
//| Custor indicator deinitialization function                       |
//+------------------------------------------------------------------+
int deinit()
  {
ObjectsDeleteAll(0,OBJ_RECTANGLE);
   return(0);
  }
//+------------------------------------------------------------------+
//| Custom indicator initialization function                         |
//+------------------------------------------------------------------+
int init()
  {
   string short_name;


//---- name for DataWindow and indicator subwindow label
   short_name="MarketProfile";
   IndicatorShortName(short_name);
   SetIndexLabel(0,short_name);

   return(0);
  }

//+------------------------------------------------------------------+
//| Custom indicator iteration function                              |
//+------------------------------------------------------------------+
int start()
{
  deinit();

double onetick;
double Mediana=0;
int MaxSize=0;
int MySize=0;
int MySizeEuropa=0;
int MySizeAzia=0;
int MySizeAmerica=0;
int BACK=0;
if (lastdayStart) StartDate=Time[0];

int x=Period();
if (x>60) return(-1);
if (x<15) return(-1);


BACK=0;
while (TimeDayOfYear(Time[BACK])>TimeDayOfYear(StartDate) || TimeYear(Time[BACK])!=TimeYear(StartDate) && (BACK<Bars))
{
  BACK++;
  if (BACK>=Bars) return(0);
}//while

onetick = 1/(MathPow(10,Digits));
i=BACK;
////
int cycles;

for (cycles=CountProfile;cycles>0;cycles--)
{
  signal=false;
  LastHigh=High[i];
  LastLow=Low[i];
  while (!signal)
  {
   //if (i+1==Bars) signal=true;
   if (High[i+1]>LastHigh) LastHigh=High[i+1];
   if (Low[i+1]<LastLow) LastLow=Low[i+1];
   MaxSize=0;
   MySize=0;

   if (TimeDay(Time[i])!=TimeDay(Time[i+1]))
   {
     signal=true;
     CurPos=LastLow;
     while (CurPos<=LastHigh)
     {
       MySizeAzia=0;
       MySizeEuropa=0;
       MySizeAmerica=0;
       for (j=i;j>=BACK;j--)
       {
         if ((High[j]>=CurPos) && (Low[j]<=CurPos))
         {
           MySize++;
           if (TimeHour(Time[j])>=13)  MySizeAmerica++; else
           if ((TimeHour(Time[j])>=8) && (TimeHour(Time[j])<13)) MySizeEuropa++; else MySizeAzia++;
         }//if
       }//for
       if (MySizeAzia+MySizeEuropa+MySizeAmerica>MaxSize)
       {
         MaxSize=MySizeAzia+MySizeEuropa+MySizeAmerica;
         Mediana=CurPos;
       }

       if (i-MySizeAzia>=0)
       if(ObjectFind("rec"+"Azia"+TimeToStr(Time[i],TIME_DATE)+CurPos) == -1 && MySizeAzia!=0)
       {
         ObjectCreate("rec"+"Azia"+TimeToStr(Time[i],TIME_DATE)+CurPos, OBJ_RECTANGLE, 0, Time[i], CurPos,Time[i-MySizeAzia],CurPos+onetick);
         ObjectSet("rec"+"Azia"+TimeToStr(Time[i],TIME_DATE)+CurPos, OBJPROP_COLOR, AziaColor);
       }//if

       if(ObjectFind("rec"+"Europa"+TimeToStr(Time[i],TIME_DATE)+CurPos) == -1 && MySizeEuropa!=0)
       {
         ObjectCreate("rec"+"Europa"+TimeToStr(Time[i],TIME_DATE)+CurPos, OBJ_RECTANGLE, 0, Time[i-MySizeAzia], CurPos,Time[i-MySizeAzia-MySizeEuropa],CurPos+onetick);
         ObjectSet("rec"+"Europa"+TimeToStr(Time[i],TIME_DATE)+CurPos, OBJPROP_COLOR, EuropaColor);
       }//if

       if(ObjectFind("rec"+"America"+TimeToStr(Time[i],TIME_DATE)+CurPos) == -1 && MySizeAmerica!=0)
       {
         ObjectCreate("rec"+"America"+TimeToStr(Time[i],TIME_DATE)+CurPos, OBJ_RECTANGLE, 0, Time[i-MySizeAzia-MySizeEuropa], CurPos,Time[i-MySizeAzia-MySizeEuropa-MySizeAmerica],CurPos+onetick);
         ObjectSet("rec"+"America"+TimeToStr(Time[i],TIME_DATE)+CurPos, OBJPROP_COLOR, AmericaColor);
       }//if

       CurPos=CurPos+onetick;
     }//while

     ObjectCreate("mediana"+TimeToStr(Time[i],TIME_DATE), OBJ_RECTANGLE, 0, Time[i], Mediana,Time[i+10],Mediana+onetick);
     ObjectSet("mediana"+TimeToStr(Time[i],TIME_DATE), OBJPROP_STYLE, STYLE_SOLID);
     ObjectSet("mediana"+TimeToStr(Time[i],TIME_DATE), OBJPROP_COLOR, MedianaColor);
     BACK=i+1;
   }//if
   i++;
   if (i>=Bars) return(0);
  }//while
}//for
//----

  return(0);
}
//+------------------------------------------------------------------+
Comments