marketprofile_pob
Download script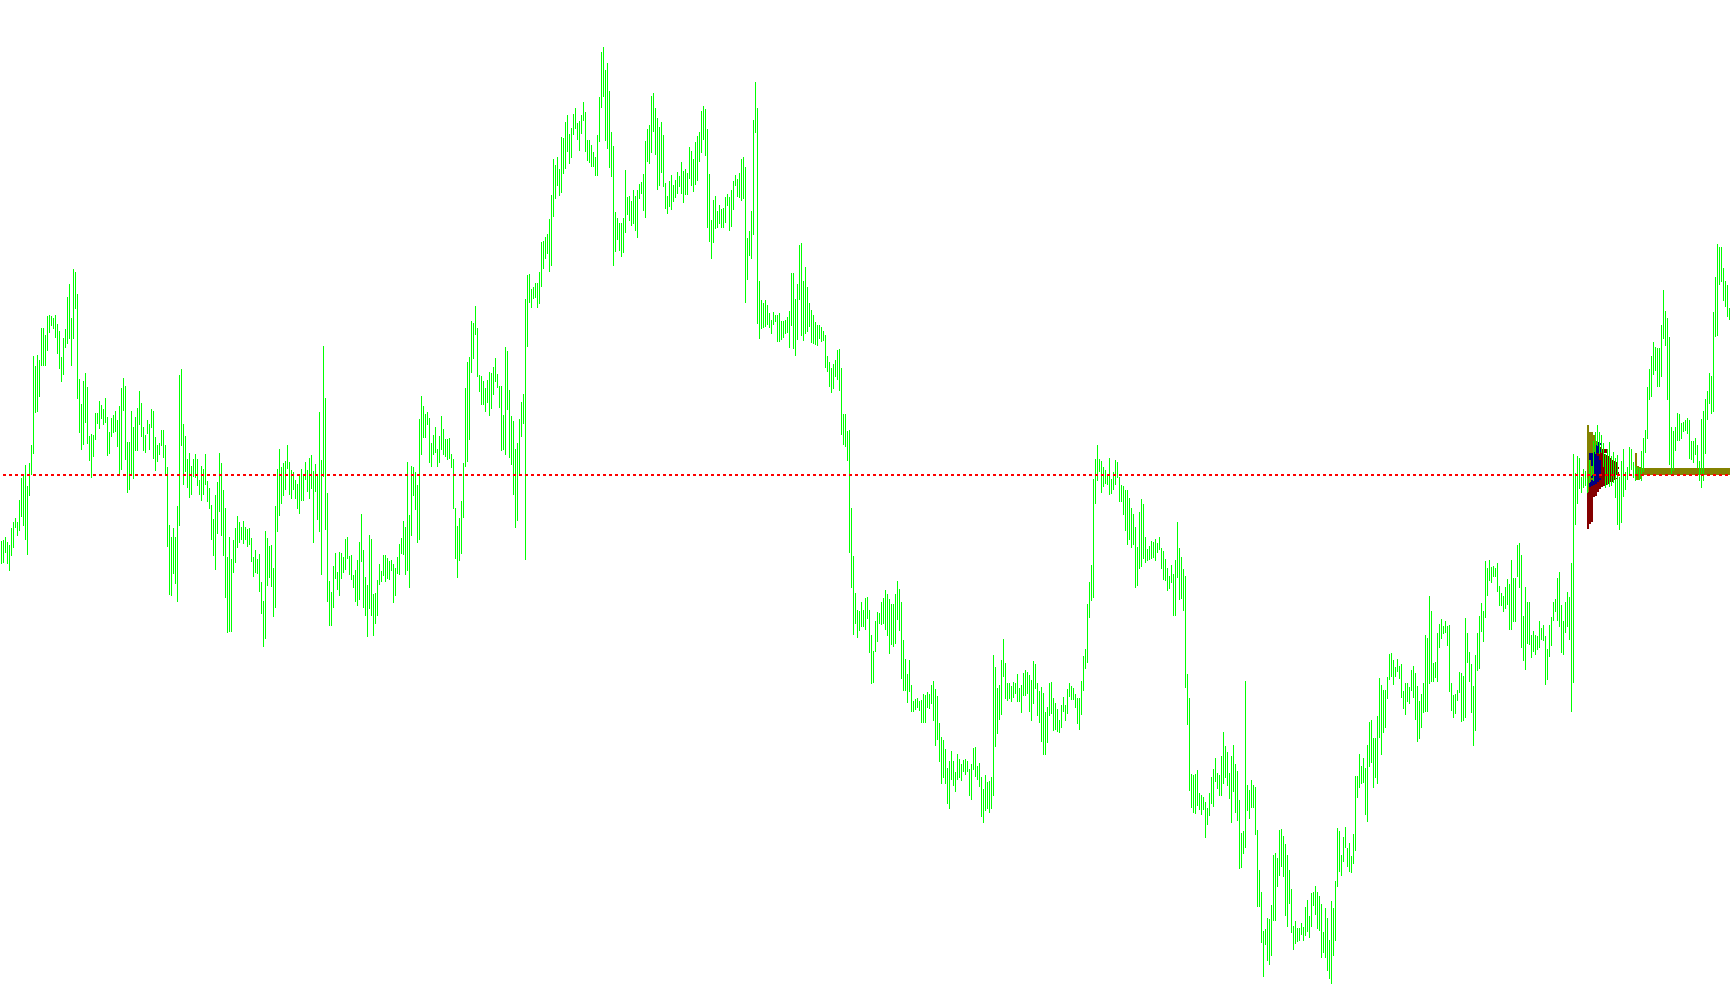
This script is designed to analyze and visualize market activity by creating a "Market Profile." Instead of just looking at simple price movements, it breaks down the trading volume and activity into distinct geographic sessions—specifically Asia, Europe, and the United States.
Core Logic Overview
The tool operates by scanning historical price data to identify specific ranges of time and price where trading activity was most concentrated. It accomplishes this through the following logical steps:
1. Data Filtering and Range Detection The script first determines the relevant timeframe for analysis based on a user-defined start date. It then looks backward through the market history to find distinct "trading cycles." It identifies the high and low boundaries of these cycles to establish the "playing field" where price action occurred.
2. Session Identification One of the primary features of this logic is its ability to distinguish between global trading sessions. By checking the timestamp of every price movement, it categorizes activity into three specific buckets:
- Asia Session
- Europe Session
- US/America Session
3. Density Mapping (The Profile) For every individual price level within a cycle, the script counts how many times the price touched that specific level during each session. It then maps these occurrences visually:
- It draws rectangular blocks on your chart to represent the "footprint" of each session.
- Each session is assigned a unique color (Asia, Europe, and US), allowing you to see at a glance which region was driving the price action at specific times.
4. Point of Balance (POC) Calculation Beyond just showing where the price went, the script identifies the "Point of Balance." This is the specific price level that experienced the highest amount of total activity across all sessions combined.
- The logic calculates the highest frequency of touches.
- It then draws a dedicated horizontal line (the POC) at that exact price level.
How to Interpret the Results
The resulting visual profile allows a trader to see "fair value" versus "imbalance." The colored rectangles show where the market spent its time, while the Point of Balance (POC) line acts as a significant structural landmark. If the price is currently far away from the POC, it suggests the market may be overextended; if it is near the POC, it indicates the area where the highest concentration of buyers and sellers agreed to trade.
//+------------------------------------------------------------------+
//|                                                MarketProfile.mq4 |
//|                             Copyright © 2006, Viatcheslav Suvorov|
//| Modified to better show "Points of Balance" by GodfreyH          |
//|                                                                  |
//| Cleaned up code, added DeleteObjects() to remove only the        |
//| objects created by this indicator and added settings for the     |
//| session/POC colors - mods by TwoBuckChuck                        |
//+------------------------------------------------------------------+
#property copyright "Viatcheslav Suvorov"

#property indicator_chart_window

extern datetime StartDate;// = D''; //removes the compiler warning
extern bool lastdayStart = true;
extern int CountProfile = 3;

// We all love custom settings
extern color Asia_Color    = Olive;
extern color Europe_Color  = Navy;
extern color US_Color      = Maroon;
extern color POC_Color     = Red;
extern int   POC_LineStyle = STYLE_DOT;

int fontsize=10;
int i,j;
double LastHigh,LastLow,CurPos;
bool signal;
datetime flag;
string Obj_Prefix;
//+------------------------------------------------------------------+
//| Custor indicator deinitialization function                       |
//+------------------------------------------------------------------+
int deinit()
{
   DeleteObjects(); //only delete our objects
   return(0);
}
//+------------------------------------------------------------------+
//| Custom indicator initialization function                         |
//+------------------------------------------------------------------+
int init()
{
   string short_name;

   Obj_Prefix = "mp__"; //object prefix

   //---- name for DataWindow and indicator subwindow label
   short_name="MarketProfile";
   IndicatorShortName(short_name);
   SetIndexLabel(0,short_name);

   if (!StartDate) StartDate = TimeCurrent();

   return(0);
}

//+------------------------------------------------------------------+
//| Custom indicator iteration function                              |
//+------------------------------------------------------------------+
int start()
{
   if (flag!=Time[0]) // Calculate on new bar.
   {
      flag=Time[0];
      deinit();
      double onetick;
      double Mediana=0;
      int MaxSize=0;
      int MySize=0;
      int MySizeEuropa=0;
      int MySizeAzia=0;
      int MySizeAmerica=0;
      int BACK=0;
      if (lastdayStart) StartDate=Time[0];

      int x=Period();
      if (x>60) return(-1);
      if (x<5) return(-1);

      BACK=0;
      while (TimeDayOfYear(Time[BACK])>TimeDayOfYear(StartDate) || TimeYear(Time[BACK])!=TimeYear(StartDate) && (BACK<Bars))
      {
         BACK++;
         if (BACK>=Bars) return(0);
      }//while

      onetick = 1/(MathPow(10,Digits));
      i=BACK;
      int cycles;

      for (cycles=CountProfile;cycles>0;cycles--)
      {
         signal=false;
         LastHigh=High[i];
         LastLow=Low[i];

         while (!signal)
         {
            //if (i+1==Bars) signal=true;
            if (High[i+1]>LastHigh) LastHigh=High[i+1];
            if (Low[i+1]<LastLow) LastLow=Low[i+1];
            MaxSize=0;
            MySize=0;

            if (TimeDay(Time[i])!=TimeDay(Time[i+1]))
            {
               signal=true;
               CurPos=LastLow;

               while (CurPos<=LastHigh)
               {
                  MySizeAzia=0;
                  MySizeEuropa=0;
                  MySizeAmerica=0;

                  for (j=i;j>=BACK;j--)
                  {
                     if ((High[j]>=CurPos) && (Low[j]<=CurPos))
                     {
                        MySize++;
                        if (TimeHour(Time[j])>=13)  MySizeAmerica++;
                        else if ((TimeHour(Time[j])>=8) && (TimeHour(Time[j])<13)) MySizeEuropa++;
                        else MySizeAzia++;

                     }//if

                  }//for

                  if (MySizeAzia+MySizeEuropa+MySizeAmerica>MaxSize)
                  {
                     MaxSize=MySizeAzia+MySizeEuropa+MySizeAmerica;
                     Mediana=CurPos;
                  }

                  if (i-MySizeAzia>=0) // hmmmm this doesn't look right
                     if(ObjectFind(Obj_Prefix+"rec"+"Azia"+TimeToStr(Time[i],TIME_DATE)+CurPos) == -1 && MySizeAzia!=0)
                     {
                        ObjectCreate(Obj_Prefix+"rec"+"Azia"+TimeToStr(Time[i],TIME_DATE)+CurPos, OBJ_RECTANGLE, 0, Time[i], CurPos,Time[i-MySizeAzia],CurPos+onetick);
                        ObjectSet(Obj_Prefix+"rec"+"Azia"+TimeToStr(Time[i],TIME_DATE)+CurPos, OBJPROP_COLOR, Asia_Color);
                     }//if

                  // FYI, we are not inside the if (i-MySizeAzia>=0) anymore. Not sure if we need to be...
                  if(ObjectFind(Obj_Prefix+"rec"+"Europa"+TimeToStr(Time[i],TIME_DATE)+CurPos) == -1 && MySizeEuropa!=0)
                  {
                     ObjectCreate(Obj_Prefix+"rec"+"Europa"+TimeToStr(Time[i],TIME_DATE)+CurPos, OBJ_RECTANGLE, 0, Time[i-MySizeAzia], CurPos,Time[i-MySizeAzia-MySizeEuropa],CurPos+onetick);
                     ObjectSet(Obj_Prefix+"rec"+"Europa"+TimeToStr(Time[i],TIME_DATE)+CurPos, OBJPROP_COLOR, Europe_Color);
                  }//if

                  if(ObjectFind(Obj_Prefix+"rec"+"America"+TimeToStr(Time[i],TIME_DATE)+CurPos) == -1 && MySizeAmerica!=0)
                  {
                     ObjectCreate(Obj_Prefix+"rec"+"America"+TimeToStr(Time[i],TIME_DATE)+CurPos, OBJ_RECTANGLE, 0, Time[i-MySizeAzia-MySizeEuropa], CurPos,Time[i-MySizeAzia-MySizeEuropa-MySizeAmerica],CurPos+onetick);
                     ObjectSet(Obj_Prefix+"rec"+"America"+TimeToStr(Time[i],TIME_DATE)+CurPos, OBJPROP_COLOR, US_Color);
                  }//if

                  CurPos=CurPos+onetick;
               }//while

               ObjectCreate(Obj_Prefix+"mediana"+TimeToStr(Time[i],TIME_DATE), OBJ_HLINE, 0, Time[i], Mediana,Time[i+10],Mediana+onetick);
               ObjectSet(Obj_Prefix+"mediana"+TimeToStr(Time[i],TIME_DATE), OBJPROP_STYLE, POC_LineStyle);
               ObjectSet(Obj_Prefix+"mediana"+TimeToStr(Time[i],TIME_DATE), OBJPROP_COLOR,POC_Color);
               ObjectSet(Obj_Prefix+"mediana"+TimeToStr(Time[i],TIME_DATE), OBJPROP_WIDTH,1);
               BACK=i+1;

            }//if

            i++;
            if (i>=Bars) return(0);

         } //while

      } //for

   } //if

   return(0);
}

//+------------------------------------------------------------------+
//| Delete only our objects                                          |
//+------------------------------------------------------------------+
int DeleteObjects()
{
   for (int i = ObjectsTotal() - 1; i >= 0; i--)
   {
       string label = ObjectName(i);
       if (StringSubstr(label, 0, StringLen(Obj_Prefix)) != Obj_Prefix)
           continue;
       ObjectDelete(label);
   }
   return(0);
}
//+------------------------------------------------------------------+
Comments