market profile
Download script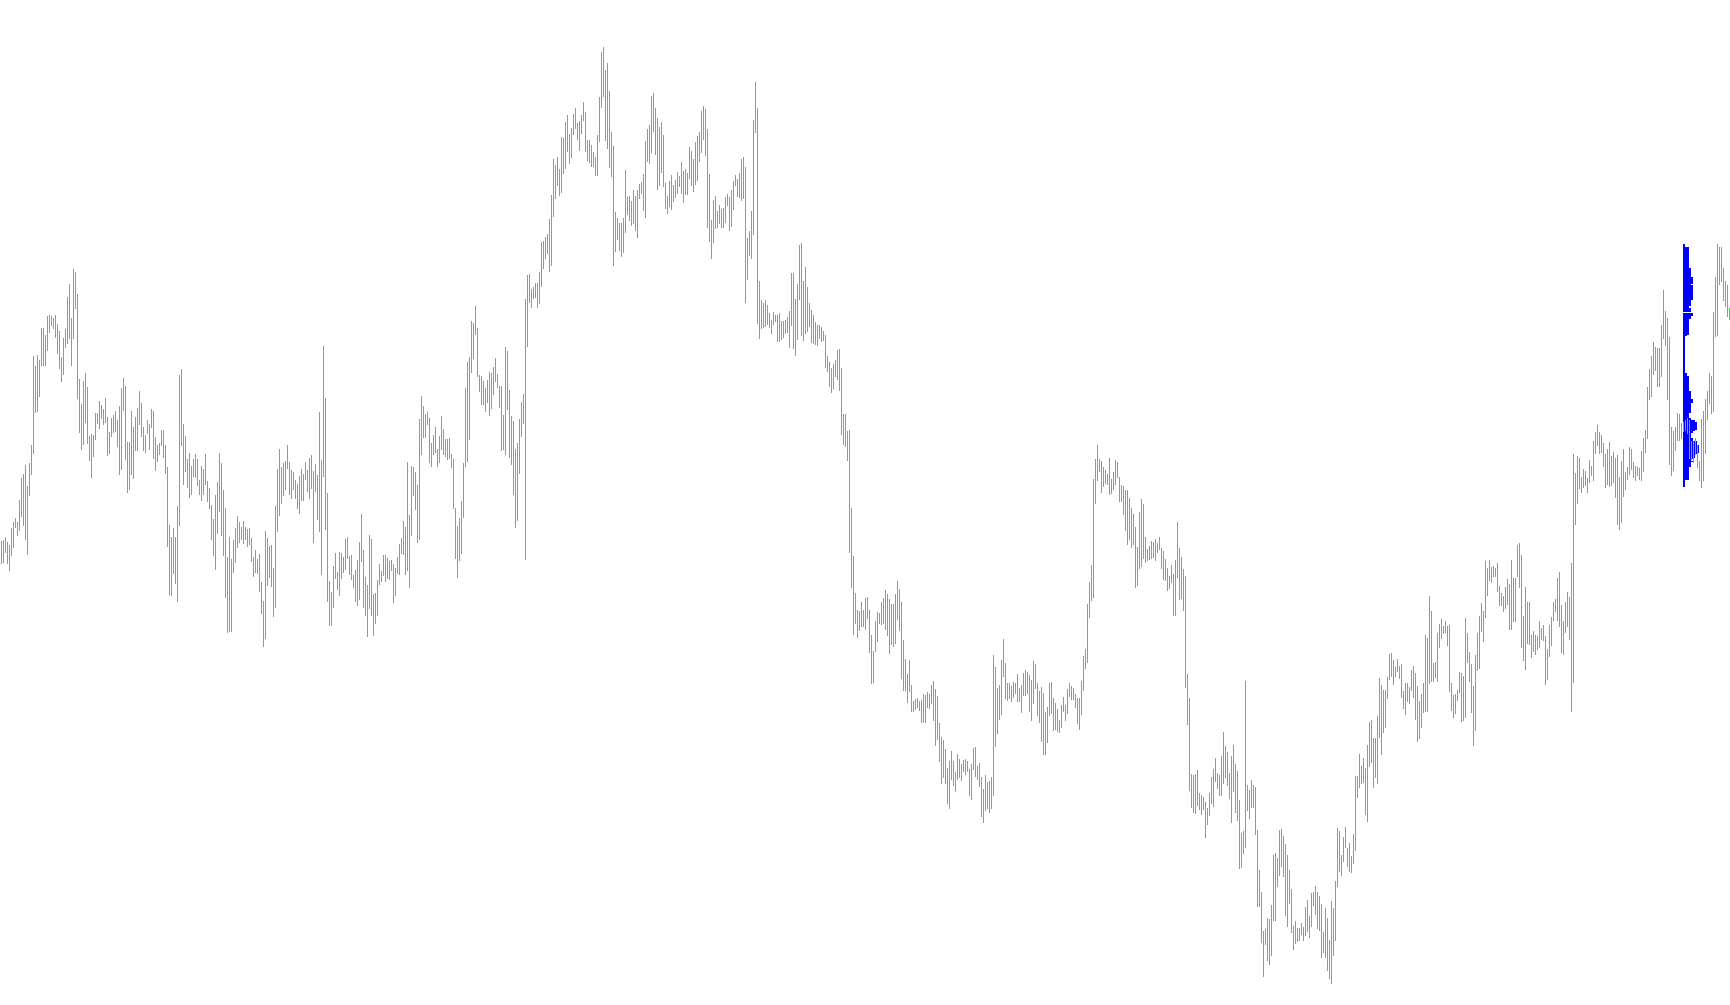
This tool is designed to provide a visual "Market Profile," which helps traders understand where price spent the most time during specific trading periods. Instead of just looking at high and low prices, this script analyzes the density of price action to identify key zones of activity and the "median" price levels.
How the Logic Works
1. Timeframe Filtering The tool is designed to work specifically on intraday charts. It checks your current timeframe and will only activate if you are viewing a period between 5 minutes and 1 hour. This ensures that the data collected is granular enough to provide a meaningful profile of the day's movement.
2. Data Scanning and Boundaries The script scans historical price data starting from a user-defined date. It looks for high and low boundaries to establish the "trading range." As it moves through the data, it identifies distinct trading sessions by detecting when the calendar day changes.
3. Volume and Density Analysis Rather than just marking where the price went, the logic calculates how often the price visited specific levels. It breaks this down into three primary global regions:
- Asia Session
- Europe Session
- America Session
The script iterates through every possible price level within a day's range. For every level, it counts how many times the price touched that point during each respective session. It then identifies which price levels had the highest "concentration" (the most frequent visits) from the market participants.
4. Visual Mapping The script translates this data into visual markers on your chart:
- Session Blocks: It draws colored rectangles representing the distribution of price activity for the Asia, Europe, and America sessions. This allows you to see at a glance which regions were most active and where the "heavy lifting" of the market occurred.
- The Median Price: The tool identifies the single price point with the highest concentration of activity across the entire period and marks it with a white line (the Median). This represents the "fair value" or the center of gravity for that specific trading day.
Summary for the User
In simple terms, this script tells you where the "crowd" is trading. By highlighting where the price spent the most time during different global sessions and marking the median point of the day, it helps you visualize market equilibrium and identify which price zones are being supported or resisted by the majority of market activity.
//+------------------------------------------------------------------+
//|                                                MarketProfile.mq4 |
//|                             Copyright © 2006, Viatcheslav Suvorov|
//+------------------------------------------------------------------+
#property copyright "Viatcheslav Suvorov"

#property indicator_chart_window


extern datetime StartDate = D'';
extern bool lastdayStart = true;
extern int CountProfile = 2;


int fontsize=10;
int i,j;
double LastHigh,LastLow,CurPos;
bool signal;
//+------------------------------------------------------------------+
//| Custor indicator deinitialization function                       |
//+------------------------------------------------------------------+
int deinit()
  {
ObjectsDeleteAll(0,OBJ_RECTANGLE);
   return(0);
  }
//+------------------------------------------------------------------+
//| Custom indicator initialization function                         |
//+------------------------------------------------------------------+
int init()
  {
   string short_name;


//---- name for DataWindow and indicator subwindow label
   short_name="MarketProfile";
   IndicatorShortName(short_name);
   SetIndexLabel(0,short_name);

   return(0);
  }

//+------------------------------------------------------------------+
//| Custom indicator iteration function                              |
//+------------------------------------------------------------------+
int start()

  {
  deinit();
double onetick;
double Mediana=0;
int MaxSize=0;
int MySize=0;
int MySizeEuropa=0;
int MySizeAzia=0;
int MySizeAmerica=0;
int BACK=0;
if (lastdayStart) StartDate=Time[0];

int x=Period();
if (x>60) return(-1);
if (x<5) return(-1);


  BACK=0;
  while (TimeDayOfYear(Time[BACK])>TimeDayOfYear(StartDate) || TimeYear(Time[BACK])!=TimeYear(StartDate) && (BACK<Bars)) {
    BACK++;
    if (BACK>=Bars) return(0);
  }//while


onetick = 1/(MathPow(10,Digits));
i=BACK;
////
int cycles;

for (cycles=CountProfile;cycles>0;cycles--) {

signal=false;
LastHigh=High[i];
LastLow=Low[i];
while (!signal)
{
//if (i+1==Bars) signal=true;
if (High[i+1]>LastHigh) LastHigh=High[i+1];
if (Low[i+1]<LastLow) LastLow=Low[i+1];
MaxSize=0;
MySize=0;

if (TimeDay(Time[i])!=TimeDay(Time[i+1]))
   {

   signal=true;
   CurPos=LastLow;
   while (CurPos<=LastHigh){
     MySizeAzia=0;
     MySizeEuropa=0;
     MySizeAmerica=0;
     for (j=i;j>=BACK;j--) {
       if ((High[j]>=CurPos) && (Low[j]<=CurPos)) {
         MySize++;
         if (TimeHour(Time[j])>=13)  MySizeAmerica++; else
         if ((TimeHour(Time[j])>=8) && (TimeHour(Time[j])<13)) MySizeEuropa++; else
           MySizeAzia++;

       }//if
     }//for
     if (MySizeAzia+MySizeEuropa+MySizeAmerica>MaxSize){
       MaxSize=MySizeAzia+MySizeEuropa+MySizeAmerica;
       Mediana=CurPos;
     }
     if (i-MySizeAzia>=0)
     if(ObjectFind("rec"+"Azia"+TimeToStr(Time[i],TIME_DATE)+CurPos) == -1 && MySizeAzia!=0) {
           ObjectCreate("rec"+"Azia"+TimeToStr(Time[i],TIME_DATE)+CurPos, OBJ_RECTANGLE, 0, Time[i], CurPos,Time[i-MySizeAzia],CurPos+onetick);
           ObjectSet("rec"+"Azia"+TimeToStr(Time[i],TIME_DATE)+CurPos, OBJPROP_COLOR, Blue);
     }//if
     if(ObjectFind("rec"+"Europa"+TimeToStr(Time[i],TIME_DATE)+CurPos) == -1 && MySizeEuropa!=0) {
           ObjectCreate("rec"+"Europa"+TimeToStr(Time[i],TIME_DATE)+CurPos, OBJ_RECTANGLE, 0, Time[i-MySizeAzia], CurPos,Time[i-MySizeAzia-MySizeEuropa],CurPos+onetick);
           ObjectSet("rec"+"Europa"+TimeToStr(Time[i],TIME_DATE)+CurPos, OBJPROP_COLOR, Blue);
     }//if
     if(ObjectFind("rec"+"America"+TimeToStr(Time[i],TIME_DATE)+CurPos) == -1 && MySizeAmerica!=0) {
           ObjectCreate("rec"+"America"+TimeToStr(Time[i],TIME_DATE)+CurPos, OBJ_RECTANGLE, 0, Time[i-MySizeAzia-MySizeEuropa], CurPos,Time[i-MySizeAzia-MySizeEuropa-MySizeAmerica],CurPos+onetick);
           ObjectSet("rec"+"America"+TimeToStr(Time[i],TIME_DATE)+CurPos, OBJPROP_COLOR, Blue);
     }//if


     CurPos=CurPos+onetick;
   }//while
      ObjectCreate("mediana"+TimeToStr(Time[i],TIME_DATE), OBJ_RECTANGLE, 0, Time[i], Mediana,Time[i+10],Mediana+onetick);
      ObjectSet("mediana"+TimeToStr(Time[i],TIME_DATE), OBJPROP_STYLE, STYLE_SOLID);
      ObjectSet("mediana"+TimeToStr(Time[i],TIME_DATE), OBJPROP_COLOR,White);
   BACK=i+1;
   }//if
   i++;
   if (i>=Bars) return(0);
}//while
}//for
//----
   return(0);
  }
//+------------------------------------------------------------------+
Comments