marketprofile_v1
Download script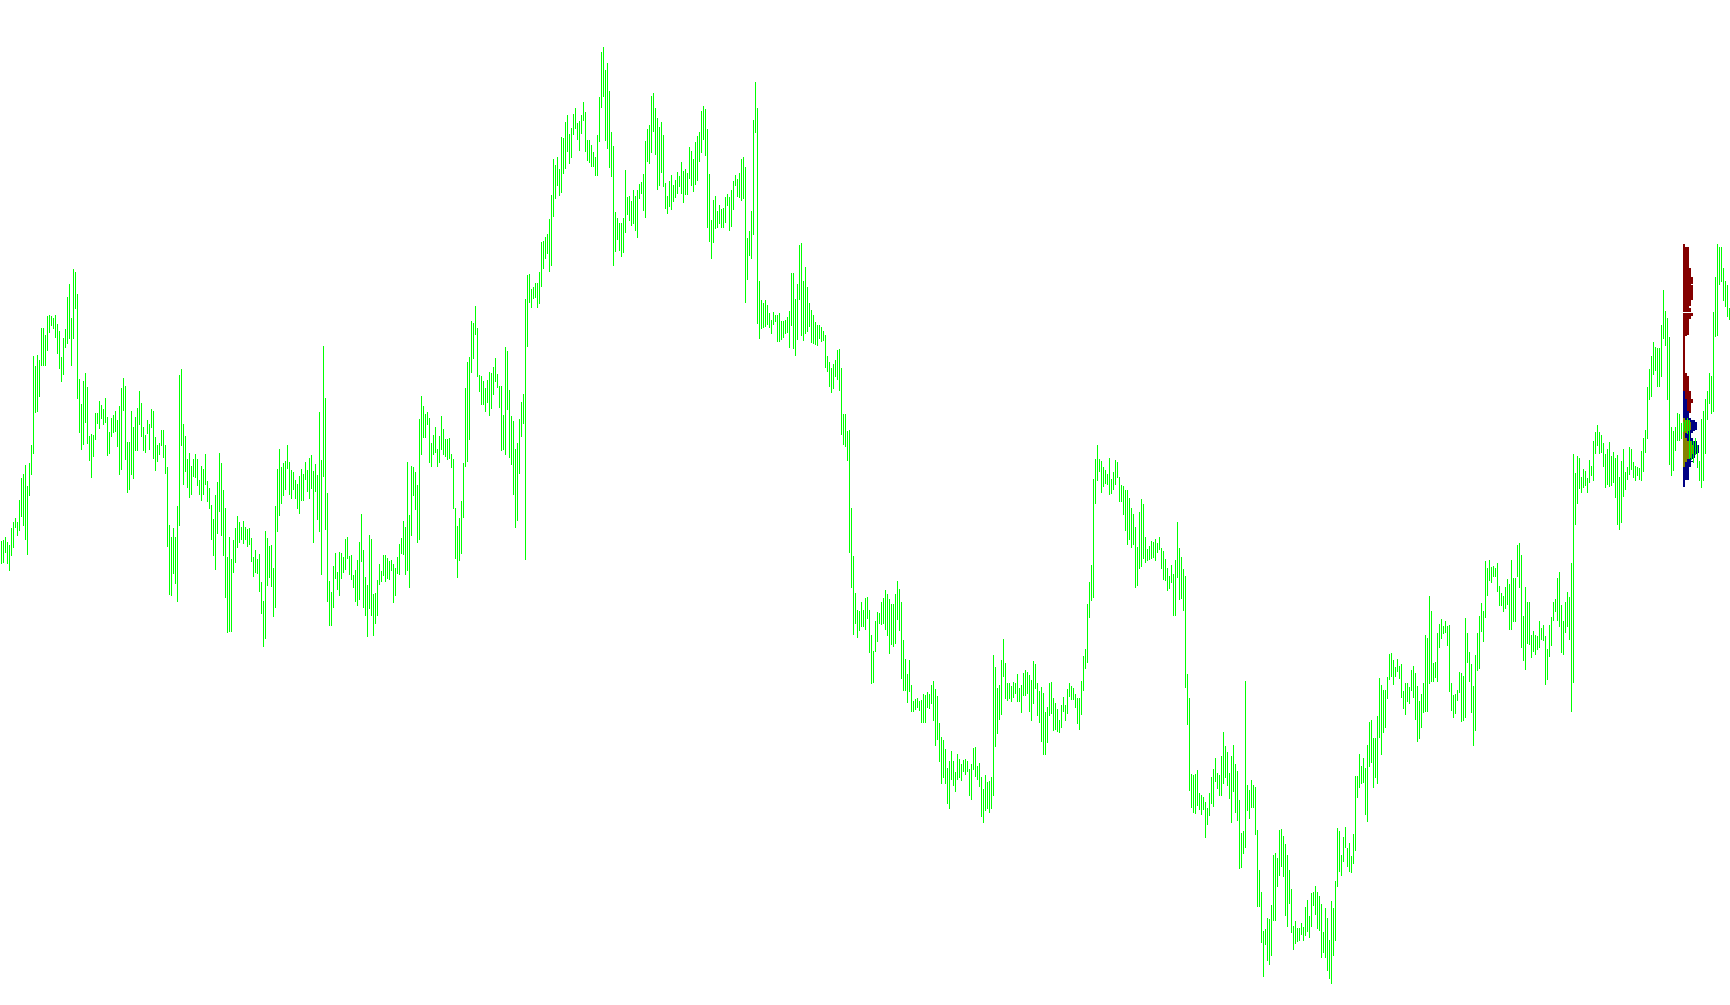
This script is designed to provide a visual representation of historical market activity by constructing what is known as a "Market Profile." Instead of just showing standard price lines, it analyzes how much time and volume were spent at specific price levels during different trading sessions.
Core Logic and Functionality
Data Organization and Filtering The script identifies specific trading periods based on the start date provided by the user. It focuses on analyzing price movements within a defined timeframe, specifically looking for patterns that repeat across a set number of cycles (profiles). To ensure accuracy, it operates best on lower timeframes, filtering out data that is too broad to provide granular detail.
Price Range Identification The tool works by scanning backward through historical data to establish the boundaries of price action (the high and low points) for a specific trading day or period. Once these boundaries are established, the script "scans" every price level between that high and low to determine where the most activity occurred.
Session Segmentation One of the primary features of this logic is its ability to differentiate between global trading regions. It categorizes market activity into three distinct geographic zones:
- Asia Session
- European Session
- American Session
Visual Mapping and "Volume" Representation As the script calculates the activity for each price level, it creates visual rectangles on the chart. The length of these rectangles represents how long the market stayed at a particular price during that specific region's session. By grouping these together, it creates a visual "profile" of the market:
- Areas with many and long rectangles indicate high-interest zones (where buyers and sellers were most active).
- Areas with few or no rectangles indicate "thin" markets where price moved quickly without much consolidation.
Identifying the Median (Point of Control) The logic concludes by identifying the "Mediana"—the price level that experienced the highest density of activity across all sessions. It marks this specific price point on the chart, allowing traders to quickly identify the "fair value" or the center of gravity for that trading period.
Summary for the User
Essentially, this script takes a messy history of price movements and organizes it into a clean, color-coded map. It shows you not just where the price went, but how much time it spent at each level, categorized by global trading sessions, highlighting the most significant zones of interest for your analysis.
//+------------------------------------------------------------------+
//|                                                MarketProfile.mq4 |
//|                             Copyright © 2006, Viatcheslav Suvorov|
//+------------------------------------------------------------------+
#property copyright "Viatcheslav Suvorov"

#property indicator_chart_window


extern datetime StartDate = D'';
extern bool lastdayStart = true;
extern int CountProfile = 2;


int fontsize=10;
int i,j;
double LastHigh,LastLow,CurPos;
bool signal;
//+------------------------------------------------------------------+
//| Custor indicator deinitialization function                       |
//+------------------------------------------------------------------+
int deinit()
  {
ObjectsDeleteAll(0,OBJ_RECTANGLE);
   return(0);
  }
//+------------------------------------------------------------------+
//| Custom indicator initialization function                         |
//+------------------------------------------------------------------+
int init()
  {
   string short_name;


//---- name for DataWindow and indicator subwindow label
   short_name="MarketProfile";
   IndicatorShortName(short_name);
   SetIndexLabel(0,short_name);

   return(0);
  }

//+------------------------------------------------------------------+
//| Custom indicator iteration function                              |
//+------------------------------------------------------------------+
int start()

  {
  deinit();
double onetick;
double Mediana=0;
int MaxSize=0;
int MySize=0;
int MySizeEuropa=0;
int MySizeAzia=0;
int MySizeAmerica=0;
int BACK=0;
if (lastdayStart) StartDate=Time[0];

int x=Period();
if (x>60) return(-1);
if (x<15) return(-1);


  BACK=0;
  while (TimeDayOfYear(Time[BACK])>TimeDayOfYear(StartDate) || TimeYear(Time[BACK])!=TimeYear(StartDate) && (BACK<Bars)) {
    BACK++;
    if (BACK>=Bars) return(0);
  }//while


onetick = 1/(MathPow(10,Digits));
i=BACK;
////
int cycles;

for (cycles=CountProfile;cycles>0;cycles--) {

signal=false;
LastHigh=High[i];
LastLow=Low[i];
while (!signal)
{
//if (i+1==Bars) signal=true;
if (High[i+1]>LastHigh) LastHigh=High[i+1];
if (Low[i+1]<LastLow) LastLow=Low[i+1];
MaxSize=0;
MySize=0;

if (TimeDay(Time[i])!=TimeDay(Time[i+1]))
   {

   signal=true;
   CurPos=LastLow;
   while (CurPos<=LastHigh){
     MySizeAzia=0;
     MySizeEuropa=0;
     MySizeAmerica=0;
     for (j=i;j>=BACK;j--) {
       if ((High[j]>=CurPos) && (Low[j]<=CurPos)) {
         MySize++;
         if (TimeHour(Time[j])>=13)  MySizeAmerica++; else
         if ((TimeHour(Time[j])>=8) && (TimeHour(Time[j])<13)) MySizeEuropa++; else
           MySizeAzia++;

       }//if
     }//for
     if (MySizeAzia+MySizeEuropa+MySizeAmerica>MaxSize){
       MaxSize=MySizeAzia+MySizeEuropa+MySizeAmerica;
       Mediana=CurPos;
     }
     if (i-MySizeAzia>=0)
     if(ObjectFind("rec"+"Azia"+TimeToStr(Time[i],TIME_DATE)+CurPos) == -1 && MySizeAzia!=0) {
           ObjectCreate("rec"+"Azia"+TimeToStr(Time[i],TIME_DATE)+CurPos, OBJ_RECTANGLE, 0, Time[i], CurPos,Time[i-MySizeAzia],CurPos+onetick);
           ObjectSet("rec"+"Azia"+TimeToStr(Time[i],TIME_DATE)+CurPos, OBJPROP_COLOR, Olive);
     }//if
     if(ObjectFind("rec"+"Europa"+TimeToStr(Time[i],TIME_DATE)+CurPos) == -1 && MySizeEuropa!=0) {
           ObjectCreate("rec"+"Europa"+TimeToStr(Time[i],TIME_DATE)+CurPos, OBJ_RECTANGLE, 0, Time[i-MySizeAzia], CurPos,Time[i-MySizeAzia-MySizeEuropa],CurPos+onetick);
           ObjectSet("rec"+"Europa"+TimeToStr(Time[i],TIME_DATE)+CurPos, OBJPROP_COLOR, Navy);
     }//if
     if(ObjectFind("rec"+"America"+TimeToStr(Time[i],TIME_DATE)+CurPos) == -1 && MySizeAmerica!=0) {
           ObjectCreate("rec"+"America"+TimeToStr(Time[i],TIME_DATE)+CurPos, OBJ_RECTANGLE, 0, Time[i-MySizeAzia-MySizeEuropa], CurPos,Time[i-MySizeAzia-MySizeEuropa-MySizeAmerica],CurPos+onetick);
           ObjectSet("rec"+"America"+TimeToStr(Time[i],TIME_DATE)+CurPos, OBJPROP_COLOR, Maroon);
     }//if


     CurPos=CurPos+onetick;
   }//while
      ObjectCreate("mediana"+TimeToStr(Time[i],TIME_DATE), OBJ_RECTANGLE, 0, Time[i], Mediana,Time[i+10],Mediana+onetick);
      ObjectSet("mediana"+TimeToStr(Time[i],TIME_DATE), OBJPROP_STYLE, STYLE_SOLID);
      ObjectSet("mediana"+TimeToStr(Time[i],TIME_DATE), OBJPROP_COLOR,White);
   BACK=i+1;
   }//if
   i++;
   if (i>=Bars) return(0);
}//while
}//for
//----
   return(0);
  }
//+------------------------------------------------------------------+
Comments