Math--System-Trader
Download script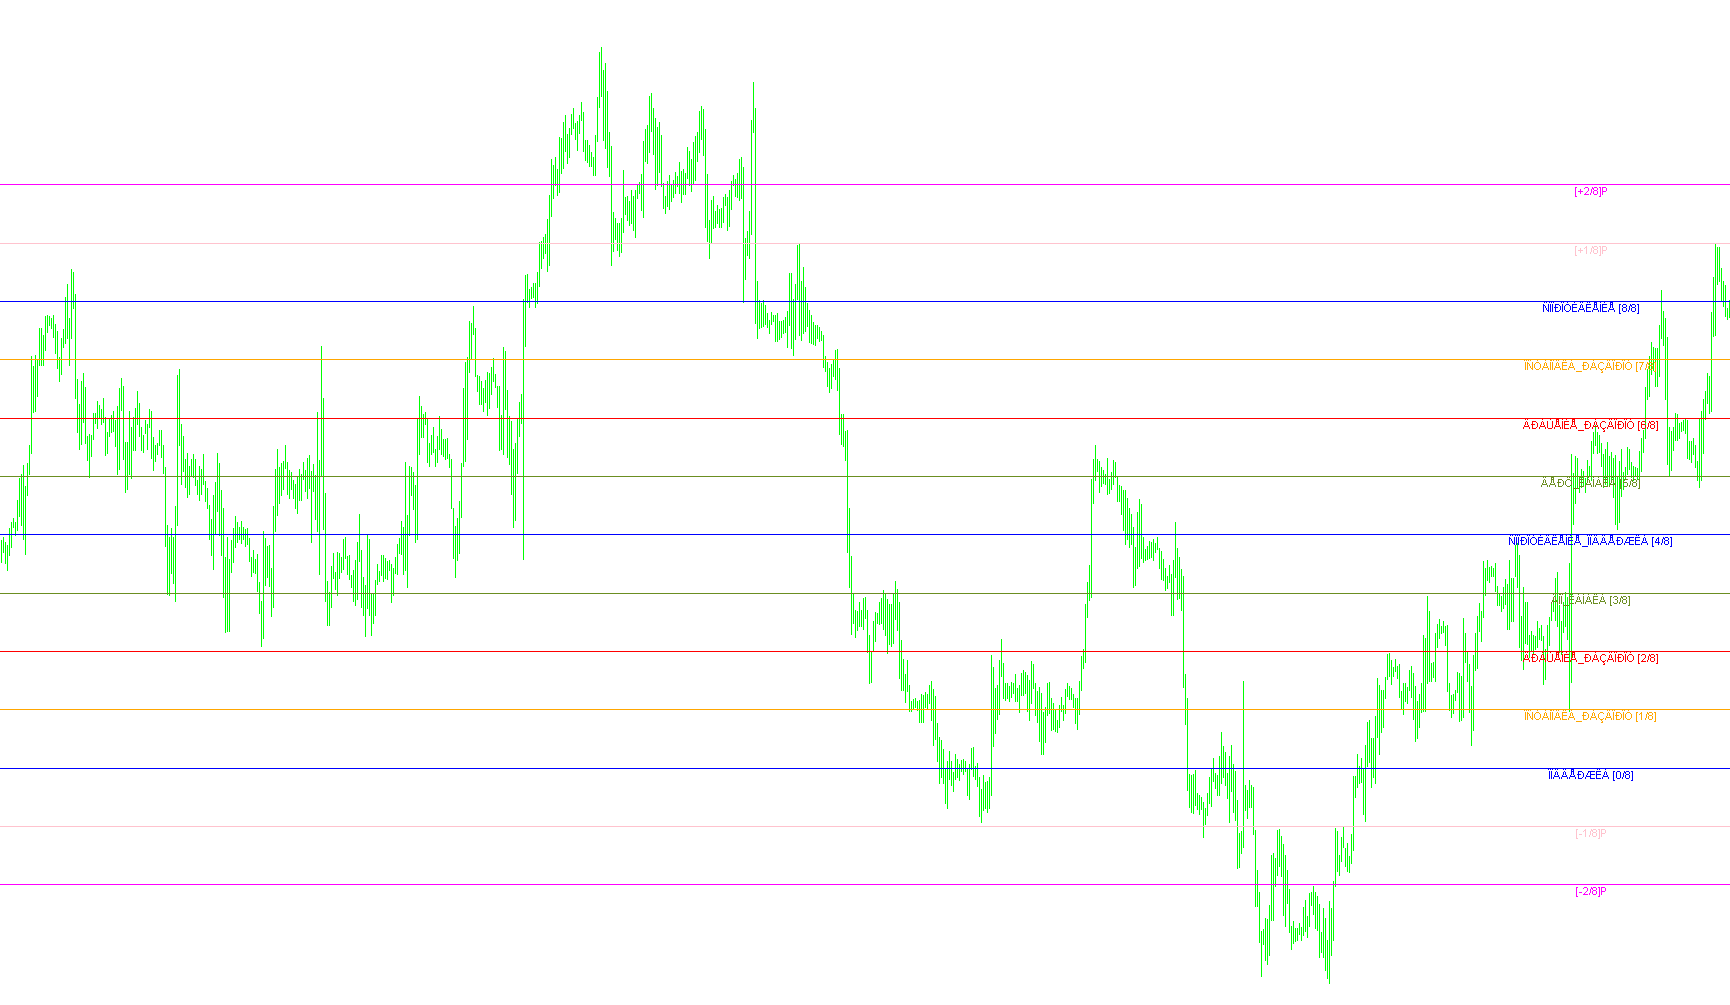
Technical Logic Overview
This script is designed to function as a dynamic visual indicator for financial charts. It automatically analyzes price action to identify significant structural levels and projects a series of horizontal support and resistance lines based on a recursive mathematical progression.
Core Identification Logic
The tool begins by scanning the recent history of the market (based on a user-defined period) to identify the absolute highest peak and the absolute lowest valley reached. Once these two points are established, the script calculates the "range" or volatility of that specific price movement.
Dynamic Scaling and Fractal Analysis
Unlike standard indicators that use fixed numbers, this logic adapts to the scale of the asset being traded. It evaluates the price magnitude to determine a "fractal" value. This ensures that whether you are trading an asset with very high prices (like certain indices) or very low prices (like some forex pairs), the spacing and depth of the generated lines remain proportional and visually consistent.
Mathematical Projection
The script uses logarithmic mathematics to calculate an "octave"—a fundamental unit of measurement derived from the current price range. It then establishes a primary boundary (Minimum) and determines secondary boundaries based on specific mathematical proportions:
- Proportional Analysis: The tool checks if the current price action falls within specific geometric sectors of the identified range.
- Coordinate Mapping: Based on where the price sits relative to these sectors, the script "unlocks" various internal levels.
- Weighted Summation: It aggregates these unlocked points to determine a high and low anchor.
Visual Representation
The final output is a sophisticated grid of 13 distinct horizontal lines. These lines are not placed randomly; they represent a balanced distribution:
- Balanced Distribution: The lines are organized into a sequence that extends both above and below the current price action (representing overshoots and structural boundaries).
- Dynamic Movement: Because the "Minimum" and "Maximum" anchors are recalculated every time the market creates a new high or low, the entire grid of 13 lines moves fluidly in real-time to stay relevant to current market conditions.
- Visual Coding: Each level is assigned a specific color and a corresponding label, allowing traders to distinguish between different structural "zones" (such as equilibrium points, overshoots, or primary support/resistance).
Summary of Behavior
In simple terms, the script looks at how far the price has moved recently, determines the "natural" scale of that move, and then paints a complete map of potential equilibrium levels. As the price moves and creates new extremes, the entire map redraws itself to reflect the new reality of the market's range.
//+------------------------------------------------------------------+
//|                                                                  |
//|                 Copyright © 1999-2007, MetaQuotes Software Corp. |
//|                                         http://www.metaquotes.ru |
//+------------------------------------------------------------------+
#property indicator_chart_window
//----
extern int P=64;
extern int StepBack=0;
//----
double  dmml=0,dvtl=0,sum =0,v1=0,v2=0,mn=0,mx=0,x1=0,x2=0,x3=0,x4=0,x5=0,x6=0,y1=0,y2=0,y3=0,y4=0,y5=0,y6=0,octave=0,fractal=0,range  =0,finalH =0,finalL =0,mml[13];
string  ln_txt[13],
buff_str="";
int
bn_v1  =0,
bn_v2  =0,
OctLinesCnt=13,
mml_thk=8,
mml_clr[13],
mml_shft=3,
nTime=0,
CurPeriod=0,
nDigits=0,
i=0;
//+------------------------------------------------------------------+
//|                                                                  |
//+------------------------------------------------------------------+
  int init()
  {
   ln_txt[0] ="[-2/8]P";
   ln_txt[1] ="[-1/8]P";   ln_txt[2] ="ÏÎÄÄÅÐÆÊÀ [0/8]";
   ln_txt[3] ="ÎÑÒÀÍÎÂÊÀ_ÐÀÇÂÎÐÎÒ [1/8]";
   ln_txt[4] ="ÂÐÀÙÅÍÈÅ_ÐÀÇÂÎÐÎÒ [2/8]";
   ln_txt[5] ="ÄÍÎ_ÊÀÍÀËÀ [3/8]";
   ln_txt[6] ="ÑÎÏÐÎÒÈÂËÅÍÈÅ_ÏÎÄÄÅÐÆÊÀ [4/8]";
   ln_txt[7] ="ÂÅÐÕ_ÊÀÍÀËÀ [5/8]";
   ln_txt[8] ="ÂÐÀÙÅÍÈÅ_ÐÀÇÂÎÐÎÒ [6/8]";
   ln_txt[9] ="ÎÑÒÀÍÎÂÊÀ_ÐÀÇÂÎÐÎÒ [7/8]";
   ln_txt[10]="ÑÎÏÐÎÒÈÂËÅÍÈÅ [8/8]";
   ln_txt[11]="[+1/8]P";// "overshoot [+1/8]";
   ln_txt[12]="[+2/8]P";// "extremely overshoot [+2/8]";
//----
   mml_shft=25;
   mml_thk =3;
//----
   mml_clr[0] =Magenta;
   mml_clr[1] =Pink;
   mml_clr[2] =Blue;
   mml_clr[3] =Orange;
   mml_clr[4] =Red;
   mml_clr[5] =OliveDrab;
   mml_clr[6] =Blue;
   mml_clr[7] =OliveDrab;
   mml_clr[8] =Red;
   mml_clr[9] =Orange;
   mml_clr[10]=Blue;
   mml_clr[11]=Pink;
   mml_clr[12]=Magenta;
//----
   return(0);
  }
//+------------------------------------------------------------------+
//|                                                                  |
//+------------------------------------------------------------------+
  int deinit()
  {
   Comment(" ");
     for(i=0;i<OctLinesCnt;i++)
     {
      buff_str="mml"+i;
      ObjectDelete(buff_str);
      buff_str="mml_txt"+i;
      ObjectDelete(buff_str);
     }
//----
   return(0);
  }
//+------------------------------------------------------------------+
//|                                                                  |
//+------------------------------------------------------------------+
  int start()
  {
     if((nTime!=Time[0]) || (CurPeriod!=Period()))
     {
      bn_v1=Lowest(NULL,0,MODE_LOW,P+StepBack,0);
      bn_v2=Highest(NULL,0,MODE_HIGH,P+StepBack,0);
//----
      v1=Low[bn_v1];
      v2=High[bn_v2];
//----
      if(v2<=250000 && v2>25000 )
         fractal=100000;
      else
         if(v2<=25000 && v2>2500 )
            fractal=10000;
         else
            if(v2<=2500 && v2>250 )
               fractal=1000;
            else
               if(v2<=250 && v2>25 )
                  fractal=100;
               else
                  if(v2<=25 && v2>12.5 )
                     fractal=12.5;
                  else
                     if(v2<=12.5 && v2>6.25)
                        fractal=12.5;
                     else
                        if(v2<=6.25 && v2>3.125 )
                           fractal=6.25;
                        else
                           if(v2<=3.125 && v2>1.5625 )
                              fractal=3.125;
                           else
                              if(v2<=1.5625 && v2>0.390625 )
                                 fractal=1.5625;
                              else
                                 if(v2<=0.390625 && v2>0)
                                    fractal=0.1953125;
      range=(v2-v1);
      sum=MathFloor(MathLog(fractal/range)/MathLog(2));
      octave=fractal*(MathPow(0.5,sum));
      mn=MathFloor(v1/octave)*octave;
      if((mn+octave)>v2 )
         mx=mn+octave;
      else
         mx=mn+(2*octave);
      if((v1>=(3*(mx-mn)/16+mn)) && (v2<=(9*(mx-mn)/16+mn)) )
         x2=mn+(mx-mn)/2;
      else x2=0;
      if((v1>=(mn-(mx-mn)/8))&& (v2<=(5*(mx-mn)/8+mn)) && (x2==0) )
         x1=mn+(mx-mn)/2;
      else x1=0;
      if((v1>=(mn+7*(mx-mn)/16))&& (v2<=(13*(mx-mn)/16+mn)) )
         x4=mn+3*(mx-mn)/4;
      else x4=0;
      if((v1>=(mn+3*(mx-mn)/8))&& (v2<=(9*(mx-mn)/8+mn))&& (x4==0) )
         x5=mx;
      else  x5=0;
      if((v1>=(mn+(mx-mn)/8))&& (v2<=(7*(mx-mn)/8+mn))&& (x1==0) && (x2==0) && (x4==0) && (x5==0) )
         x3=mn+3*(mx-mn)/4;
      else x3=0;
      if((x1+x2+x3+x4+x5) ==0 )
         x6=mx;
      else x6=0;
      finalH=x1+x2+x3+x4+x5+x6;
      if(x1>0 )
         y1=mn;
      else y1=0;
      if(x2>0 )
         y2=mn+(mx-mn)/4;
      else y2=0;
      if(x3>0 )
         y3=mn+(mx-mn)/4;
      else y3=0;
      if(x4>0 )
         y4=mn+(mx-mn)/2;
      else y4=0;
      if(x5>0 )
         y5=mn+(mx-mn)/2;
      else y5=0;
      if((finalH>0) && ((y1+y2+y3+y4+y5)==0) )
         y6=mn;
      else y6=0;
      finalL=y1+y2+y3+y4+y5+y6;
        for( i=0; i<OctLinesCnt; i++)
        {
         mml[i]=0;
        }
      dmml=(finalH-finalL)/8;
      mml[0] =(finalL-dmml*2); //-2/8
        for( i=1; i<OctLinesCnt; i++)
        {
         mml[i]=mml[i-1] + dmml;
        }
        for( i=0; i<OctLinesCnt; i++ )
        {
         buff_str="mml"+i;
           if(ObjectFind(buff_str)==-1)
           {
            ObjectCreate(buff_str, OBJ_HLINE, 0, Time[0], mml[i]);
            ObjectSet(buff_str, OBJPROP_STYLE, STYLE_SOLID);
            ObjectSet(buff_str, OBJPROP_COLOR, mml_clr[i]);
            ObjectMove(buff_str, 0, Time[0],  mml[i]);
           }
           else
           {
            ObjectMove(buff_str, 0, Time[0],  mml[i]);
           }
         buff_str="mml_txt"+i;
           if(ObjectFind(buff_str)==-1)
           {
            ObjectCreate(buff_str, OBJ_TEXT, 0, Time[mml_shft], mml_shft);
            ObjectSetText(buff_str, ln_txt[i], 8, "Arial", mml_clr[i]);
            ObjectMove(buff_str, 0, Time[mml_shft],  mml[i]);
           }
           else
           {
            ObjectMove(buff_str, 0, Time[mml_shft],  mml[i]);
           }
        }
      nTime   =Time[0];
      CurPeriod= Period();
     }
//----
   return(0);
  }
//+------------------------------------------------------------------+
Comments