Market Profile(1)
Download script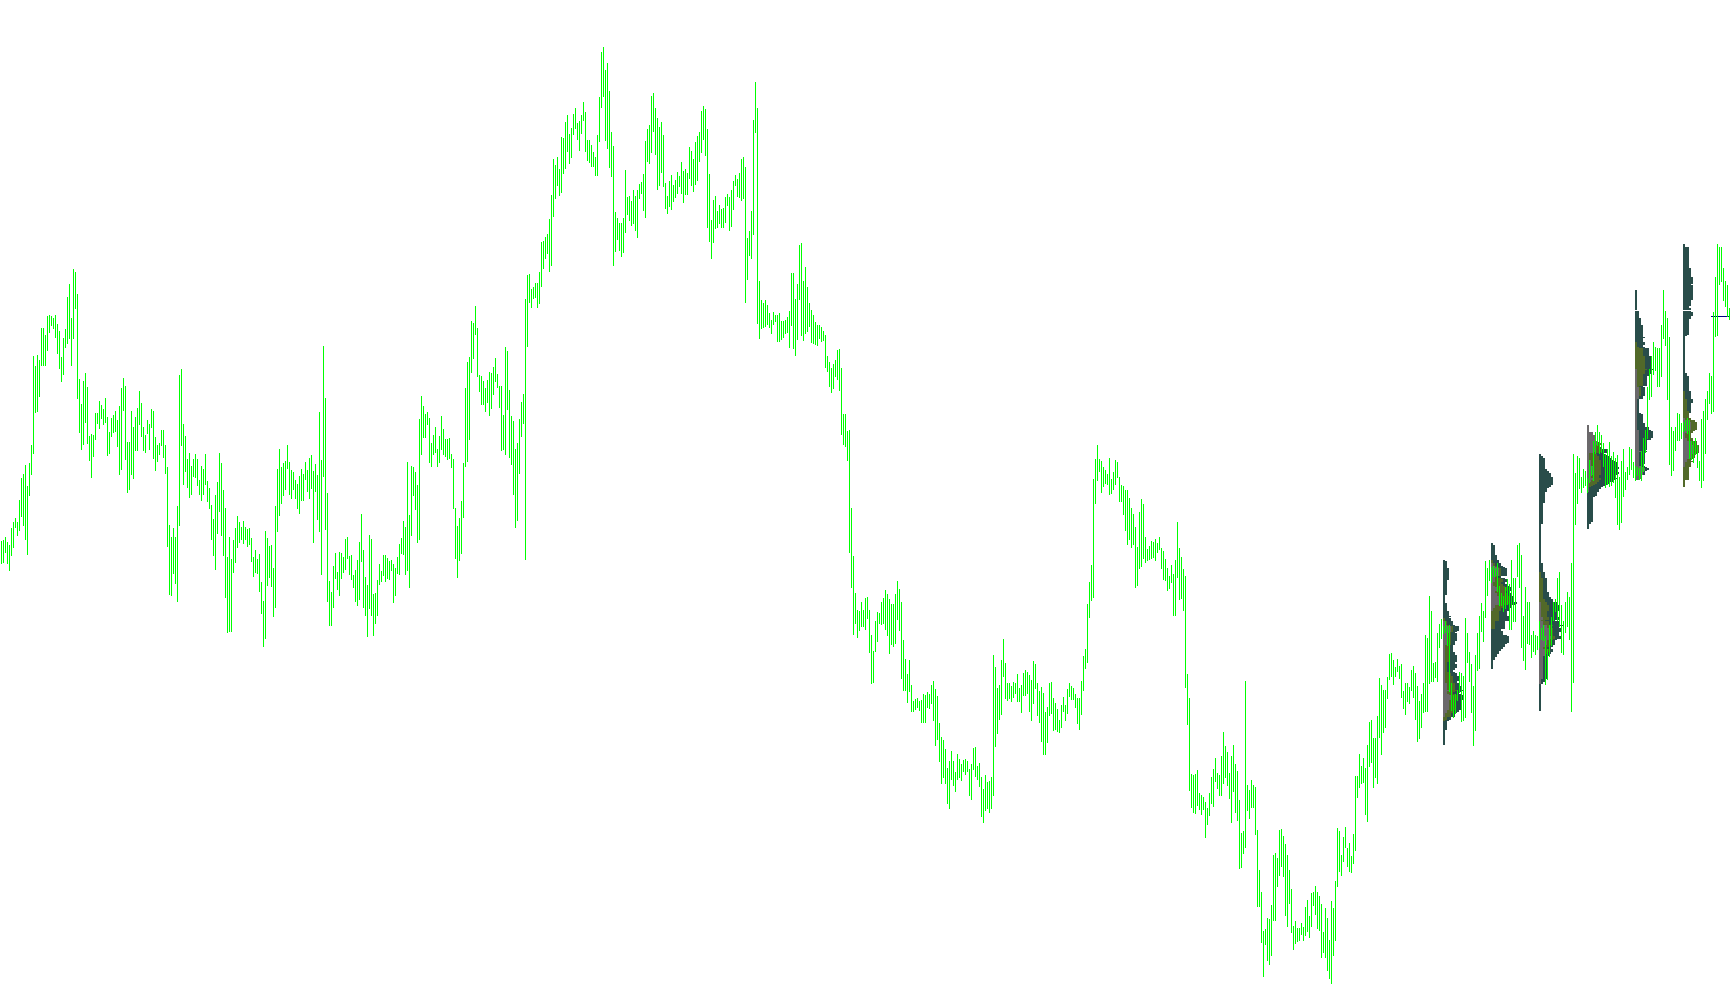
This tool is designed to provide a visual representation of historical market activity, specifically focusing on how price levels were traded across different geographic sessions. Rather than just showing a simple price line, it builds a "profile" that highlights the density of trading activity at various price points.
Core Functionality
The script analyzes the movement of prices over a specific timeframe to identify which price levels saw the most interaction. It works by scanning through historical data and grouping information based on three distinct geographical sessions: Asia, Europe, and America.
Key Logic Components
1. Session Segmentation The tool automatically categorizes trading activity based on the time of day. It distinguishes between:
- Asia Session: Early trading hours.
- Europe Session: Mid-day trading hours.
- America Session: Late-day trading hours.
2. Density Mapping (The "Profile") As the script processes historical data, it checks every price level to see how many times the market traded at that specific point. It tracks these occurrences for each session individually. The goal is to determine where the "crowd" was most active.
3. Visual Representation To make this data easy to interpret on a chart, the tool draws colored rectangles:
- Each color corresponds to one of the three geographical sessions (Asia, Europe, and America).
- The length and position of these rectangles indicate where and when the heavy trading occurred during that specific period.
- By looking at these blocks, a user can see at a glance which price zones were most popular during different times of the day.
4. The Median Line In addition to the session blocks, the script calculates a "Median" value. This represents the point of maximum density—essentially the price level where the highest volume of trading occurred regardless of the session. It places a specific marker on this level to highlight the primary area of market interest.
Summary for the User
Essentially, this script transforms raw price history into a visual map of "supply and demand" zones. By using different colors for different global sessions, it allows you to see how trading behavior shifts as one region wakes up and another goes to sleep, pinpointing exactly where the most significant market action took place.
//+------------------------------------------------------------------+
//|                                                MarketProfile.mq4 |
//|                             Copyright © 2006, Viatcheslav Suvorov|
//+------------------------------------------------------------------+
#property copyright "Viatcheslav Suvorov"

#property indicator_chart_window

extern datetime StartDate = D'1/1/2007';
extern bool lastdayStart = true;
extern int CountProfile = 7;
extern color AziaColor=DimGray;
extern color EuropaColor=DarkOliveGreen;
extern color AmericaColor=DarkSlateGray;
extern color MedianaColor=Navy;

int fontsize=10;
int i,j;
double LastHigh,LastLow,CurPos;
bool signal;
//+------------------------------------------------------------------+
//| Custor indicator deinitialization function                       |
//+------------------------------------------------------------------+
int deinit()
  {
ObjectsDeleteAll(0,OBJ_RECTANGLE);
   return(0);
  }
//+------------------------------------------------------------------+
//| Custom indicator initialization function                         |
//+------------------------------------------------------------------+
int init()
  {
   string short_name;


//---- name for DataWindow and indicator subwindow label
   short_name="MarketProfile";
   IndicatorShortName(short_name);
   SetIndexLabel(0,short_name);

   return(0);
  }

//+------------------------------------------------------------------+
//| Custom indicator iteration function                              |
//+------------------------------------------------------------------+
int start()
{
  deinit();

double onetick;
double Mediana=0;
int MaxSize=0;
int MySize=0;
int MySizeEuropa=0;
int MySizeAzia=0;
int MySizeAmerica=0;
int BACK=0;
if (lastdayStart) StartDate=Time[0];

int x=Period();
if (x>60) return(-1);
if (x<15) return(-1);


BACK=0;
while (TimeDayOfYear(Time[BACK])>TimeDayOfYear(StartDate) || TimeYear(Time[BACK])!=TimeYear(StartDate) && (BACK<Bars))
{
  BACK++;
  if (BACK>=Bars) return(0);
}//while

onetick = 1/(MathPow(10,Digits));
i=BACK;
////
int cycles;

for (cycles=CountProfile;cycles>0;cycles--)
{
  signal=false;
  LastHigh=High[i];
  LastLow=Low[i];
  while (!signal)
  {
   //if (i+1==Bars) signal=true;
   if (High[i+1]>LastHigh) LastHigh=High[i+1];
   if (Low[i+1]<LastLow) LastLow=Low[i+1];
   MaxSize=0;
   MySize=0;

   if (TimeDay(Time[i])!=TimeDay(Time[i+1]))
   {
     signal=true;
     CurPos=LastLow;
     while (CurPos<=LastHigh)
     {
       MySizeAzia=0;
       MySizeEuropa=0;
       MySizeAmerica=0;
       for (j=i;j>=BACK;j--)
       {
         if ((High[j]>=CurPos) && (Low[j]<=CurPos))
         {
           MySize++;
           if (TimeHour(Time[j])>=13)  MySizeAmerica++; else
           if ((TimeHour(Time[j])>=8) && (TimeHour(Time[j])<13)) MySizeEuropa++; else MySizeAzia++;
         }//if
       }//for
       if (MySizeAzia+MySizeEuropa+MySizeAmerica>MaxSize)
       {
         MaxSize=MySizeAzia+MySizeEuropa+MySizeAmerica;
         Mediana=CurPos;
       }

       if (i-MySizeAzia>=0)
       if(ObjectFind("rec"+"Azia"+TimeToStr(Time[i],TIME_DATE)+CurPos) == -1 && MySizeAzia!=0)
       {
         ObjectCreate("rec"+"Azia"+TimeToStr(Time[i],TIME_DATE)+CurPos, OBJ_RECTANGLE, 0, Time[i], CurPos,Time[i-MySizeAzia],CurPos+onetick);
         ObjectSet("rec"+"Azia"+TimeToStr(Time[i],TIME_DATE)+CurPos, OBJPROP_COLOR, AziaColor);
       }//if

       if(ObjectFind("rec"+"Europa"+TimeToStr(Time[i],TIME_DATE)+CurPos) == -1 && MySizeEuropa!=0)
       {
         ObjectCreate("rec"+"Europa"+TimeToStr(Time[i],TIME_DATE)+CurPos, OBJ_RECTANGLE, 0, Time[i-MySizeAzia], CurPos,Time[i-MySizeAzia-MySizeEuropa],CurPos+onetick);
         ObjectSet("rec"+"Europa"+TimeToStr(Time[i],TIME_DATE)+CurPos, OBJPROP_COLOR, EuropaColor);
       }//if

       if(ObjectFind("rec"+"America"+TimeToStr(Time[i],TIME_DATE)+CurPos) == -1 && MySizeAmerica!=0)
       {
         ObjectCreate("rec"+"America"+TimeToStr(Time[i],TIME_DATE)+CurPos, OBJ_RECTANGLE, 0, Time[i-MySizeAzia-MySizeEuropa], CurPos,Time[i-MySizeAzia-MySizeEuropa-MySizeAmerica],CurPos+onetick);
         ObjectSet("rec"+"America"+TimeToStr(Time[i],TIME_DATE)+CurPos, OBJPROP_COLOR, AmericaColor);
       }//if

       CurPos=CurPos+onetick;
     }//while

     ObjectCreate("mediana"+TimeToStr(Time[i],TIME_DATE), OBJ_RECTANGLE, 0, Time[i], Mediana,Time[i+10],Mediana+onetick);
     ObjectSet("mediana"+TimeToStr(Time[i],TIME_DATE), OBJPROP_STYLE, STYLE_SOLID);
     ObjectSet("mediana"+TimeToStr(Time[i],TIME_DATE), OBJPROP_COLOR, MedianaColor);
     BACK=i+1;
   }//if
   i++;
   if (i>=Bars) return(0);
  }//while
}//for
//----

  return(0);
}
//+------------------------------------------------------------------+
Comments