MAProfit2
Download script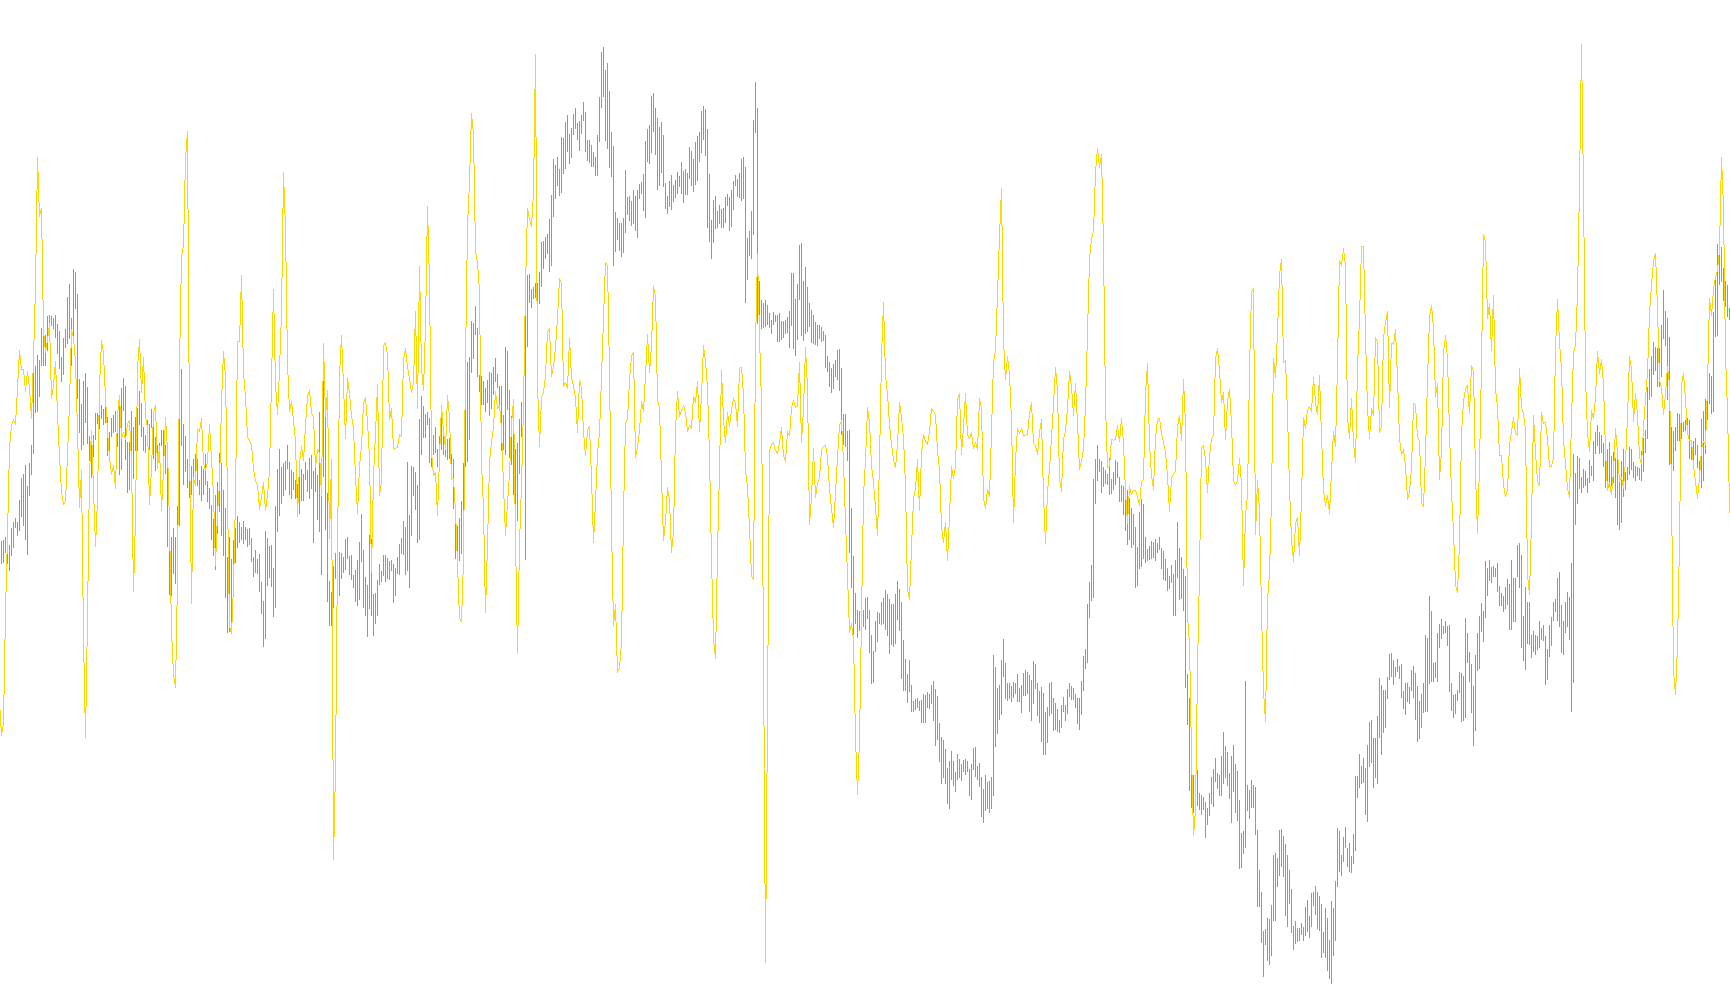
This script functions as a specialized visual tool designed to help traders measure the dynamic distance between two different moving averages on a financial chart. Instead of simply plotting the moving averages themselves, it calculates the mathematical "gap" or spread between them, providing a clearer picture of momentum and trend strength.
Core Logic and Functionality
1. Dynamic Data Retrieval The script is designed to be flexible by pulling its primary settings—specifically the timeframes for the short and long moving averages and the calculation method—from global variables. This allows the tool to stay synchronized with specific currency pairs or assets without needing manual constant adjustments; it looks for custom parameters tied specifically to the symbol and timeframe you are currently viewing.
2. Dual-Moving Average Comparison The heart of the logic involves monitoring two distinct types of moving averages simultaneously:
- A Short-Term Average: This tracks recent price action quickly, reacting to immediate market changes.
- A Long-Term Average: This represents the broader trend, smoothing out minor fluctuations to show the overall direction of the market.
3. The Calculation (The "Difference") For every point in history on your chart, the script performs a three-step calculation:
- It identifies the current value of the short-term average.
- It identifies the current value of the long-term average.
- It subtracts the long-term value from the short-term value and converts that difference into "Points" (the smallest unit of price movement).
4. Visual Output The result is displayed in a separate window at the bottom of your trading platform as a red line. Rather than showing price, this line represents the relative distance between the two trends.
How to Interpret the Results
- Expanding Distance: When the line moves further away from zero, it indicates that the short-term price action is accelerating away from the long-term trend, often signaling strong momentum in a specific direction.
- Contracting Distance: As the line moves closer to zero, it suggests that the short-term movement is losing steam and the price is returning toward its historical average, which may indicate a cooling off period or a potential trend reversal.
- Zero Crossing: When the line touches or crosses the zero mark, it signifies that the short-term and long-term averages have met, often occurring at key transition points in market behavior.
//+------------------------------------------------------------------+
//|                                               MA Profit Diff.mq4 |
//|                                 Copyright © 2010, Thomas Quester |
//|                                                  tquester@gmx.de |
//+------------------------------------------------------------------+
#property copyright "Copyright © 2010, Thomas Quester"
#property link      "tquester@gmx.de"

#property indicator_separate_window
#property indicator_buffers 1
#property indicator_color1 Red

double ExtMapBuffer1[];


extern int       PeriodShort=6;
extern int       PeriodLong=40;
extern int       Method=0;

//+------------------------------------------------------------------+
//| expert initialization function                                   |
//+------------------------------------------------------------------+
int init()
  {
//----
   SetIndexStyle(0,DRAW_LINE);
   SetIndexBuffer(0,ExtMapBuffer1);

   GetVars();

//----
   return(0);
  }

void GetVars()
{
   //Print("GetVars");
   string sym = Symbol()+Period();
   PeriodShort = GlobalVariableGet(sym+"PeriodShort");
   if(GetLastError()!=0) Print("Error getting "+sym+"PeriodShort");

   PeriodLong = GlobalVariableGet(sym+"PeriodLong");
   if(GetLastError()!=0) Print("Error getting "+sym+"PeriodLong");
   Method = GlobalVariableGet(sym+"Method");
   if(GetLastError()!=0) Print("Error getting "+sym+"Method");
   Print("GetVars ",sym," - ",PeriodShort,"/",PeriodLong);

}
//+------------------------------------------------------------------+
//| expert deinitialization function                                 |
//+------------------------------------------------------------------+
int deinit()
  {
//----

//----
   return(0);
  }
//+------------------------------------------------------------------+
//| expert start function                                            |
//+------------------------------------------------------------------+
int start()
  {
//----
   int i;
   double maS,maL,maLLow,maLHigh;
   GetVars();
   //Print("MA2 Periode=",PeriodShort,"/",PeriodLong);
   for (i=Bars;i>=0;i--)
   {

      maS      = iMA(NULL,0,PeriodShort,0,Method,PRICE_MEDIAN,i);
      maL      = iMA(NULL,0,PeriodLong,0,Method,PRICE_MEDIAN,i);

      ExtMapBuffer1[i] = (maS-maL)/Point;
//----
   }
   return(0);
  }
//+------------------------------------------------------------------+
Comments