MarketHoursShade_v01
Download script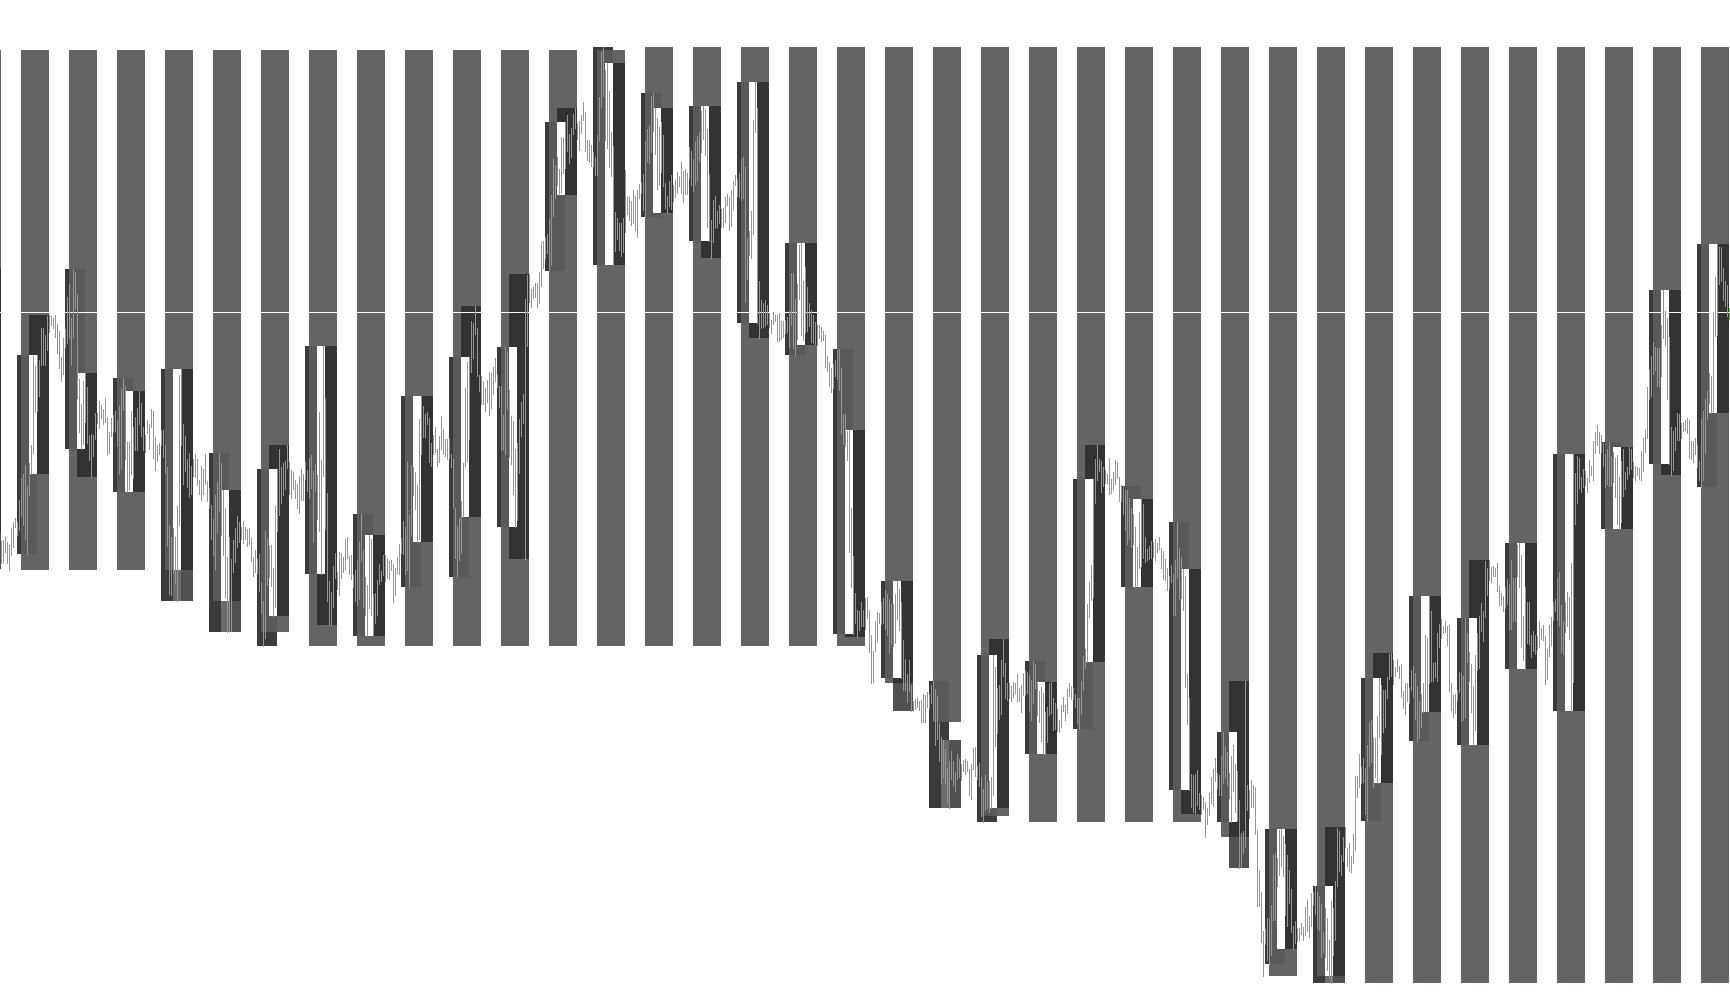
This tool is designed to provide a clear visual map of different global market sessions directly on your trading charts. By highlighting specific time blocks, it allows traders to easily identify when major global markets—such as the European, American, and Asian/Australian sessions—are active.
Core Functionality
The script automatically calculates and draws shaded rectangular zones on your chart based on predefined start and end times for three distinct trading periods. Instead of leaving you to guess which time zone is currently active, the indicator paints these areas in different colors, providing a "heat map" of market activity over a set number of previous days (defaulting to 50).
Key Features
- Multi-Session Tracking: It independently tracks three separate trading sessions simultaneously. Each session can be customized with its own name, unique color, and specific start/end times to match your preferred local time or broker time.
- Dynamic Range Identification: The script includes an intelligent logic to determine the price height of the shaded boxes. By default, it identifies the highest and lowest prices reached during that specific session's timeframe, ensuring the shading perfectly covers the "action" of that period.
- Automated Time Management: The tool handles complex calendar calculations automatically. It is designed to recognize trading days and navigate through dates properly, ensuring that the visual markers remain consistent even when crossing into new months or years.
- Clean Visual Interface: The shaded zones are set to appear in the background of your chart. This ensures that while the market sessions are clearly visible for your reference, they do not clutter your primary price action, candlesticks, or other technical indicators.
How It Benefits the Trader
This indicator is primarily used to improve "market context." By seeing these shaded blocks, a trader can quickly determine:
- Volatility Shifts: Identifying when high-volume sessions (like the New York/American overlap) begin.
- Liquidity Awareness: Visualizing periods of lower liquidity or specific regional movements.
- Consistency: Providing a consistent historical view of how the market behaves during specific hours across multiple days.
/*-----------------------------+
|			       |
| Shared by www.Aptrafx.com    |
|			       |
+------------------------------*/

//=============================================================================
//                                                MarketHoursShade_v01.mq4
//                                                     Originally by KimIV
//                                                     http://www.kimiv.ru
//
//                                                              23.11.2005
//
// 29 Nov 06: Modified by Derk Wehler to be readable.
//            Added/Changed a couple of input parameter defaults
//            No other changes.
//
//=============================================================================
#property copyright "Derk Wehler"
#property link      "none"

#property indicator_chart_window

//-------  -------------------------------
extern int    NumberOfDays = 50;
extern string s1           = "European";
extern color  Color_1      = C'60, 60, 60';
extern string Begin_1      = "07:00";
extern string End_1        = "17:00";
extern string s2           = "";
extern string s3           = "American";
extern color  Color_2      = C'80, 80, 80';
extern string Begin_2      = "13:00";
extern string End_2        = "23:00";
extern string s4           = "";
extern string s5           = "Asian/Austrailian";
extern color  Color_3      = C'100, 100, 100';
extern string Begin_3      = "23:00";
extern string End_3        = "09:00";
extern bool   HighRange    = true;


//=============================================================================
// Custom indicator initialization function
//=============================================================================
void init()
{
	DeleteObjects();
	for (int i=0; i < NumberOfDays; i++)
	{
		CreateObjects("PWT1"+i, Color_1);
		CreateObjects("PWT2"+i, Color_2);
		CreateObjects("PWT3"+i, Color_3);
	}
	Comment("");
}

//=============================================================================
// Custor indicator deinitialization function
//=============================================================================
void deinit()
{
	DeleteObjects();
	Comment("");
}

//=============================================================================
//
//=============================================================================
void CreateObjects(string no, color cl)
{
	ObjectCreate(no, OBJ_RECTANGLE, 0, 0,0, 0,0);
	ObjectSet(no, OBJPROP_STYLE, STYLE_SOLID);
	ObjectSet(no, OBJPROP_COLOR, cl);
	ObjectSet(no, OBJPROP_BACK, True);
}

//=============================================================================
//
//=============================================================================
void DeleteObjects()
{
	for (int i=0; i < NumberOfDays; i++)
	{
		ObjectDelete("PWT1"+i);
		ObjectDelete("PWT2"+i);
		ObjectDelete("PWT3"+i);
	}
}

//=============================================================================
// Custom indicator iteration function
//=============================================================================
void start()
{
	datetime dt = CurTime();

	for (int i=0; i < NumberOfDays; i++)
	{
		DrawObjects(dt, "PWT1"+i, Begin_1, End_1);
		DrawObjects(dt, "PWT2"+i, Begin_2, End_2);
		DrawObjects(dt, "PWT3"+i, Begin_3, End_3);
		dt = decDateTradeDay(dt);

		while (TimeDayOfWeek(dt) > 5)
			dt = decDateTradeDay(dt);
	}
}

//=============================================================================
//
//=============================================================================
void DrawObjects(datetime dt, string no, string tb, string te)
{
	datetime t1, t2;
	double   p1, p2;
	int      b1, b2;

	t1 = StrToTime(TimeToStr(dt, TIME_DATE) + " " + tb);
	t2 = StrToTime(TimeToStr(dt, TIME_DATE) + " " + te);
	b1 = iBarShift(NULL, 0, t1);
	b2 = iBarShift(NULL, 0, t2);
	p1 = High[Highest(NULL, 0, MODE_HIGH, b1-b2, b2)];
	p2 = Low [Lowest (NULL, 0, MODE_LOW , b1-b2, b2)];

	if (!HighRange)
	{
		p1 = 0;
		p2 = 2 * p2;
	}

	ObjectSet(no, OBJPROP_TIME1 , t1);
	ObjectSet(no, OBJPROP_PRICE1, p1);
	ObjectSet(no, OBJPROP_TIME2 , t2);
	ObjectSet(no, OBJPROP_PRICE2, p2);
}

//=============================================================================
//
//=============================================================================
datetime decDateTradeDay (datetime dt)
{
	int ty = TimeYear(dt);
	int tm = TimeMonth(dt);
	int td = TimeDay(dt);
	int th = TimeHour(dt);
	int ti = TimeMinute(dt);

	td--;
	if (td == 0)
	{
		tm--;
		if (tm == 0)
		{
			ty--;
			tm = 12;
		}
		if (tm == 1 || tm == 3 || tm == 5 || tm == 7 || tm == 8 || tm == 10 || tm == 12)
			td = 31;

		if (tm == 2)
			if (MathMod(ty, 4) == 0)
				td = 29;
			else
				td = 28;

		if (tm == 4 || tm == 6 || tm == 9 || tm == 11)
			td = 30;
	}
	return(StrToTime(ty + "." + tm + "." + td + " " + th + ":" + ti));
}
Comments