MACD_D3X
Download script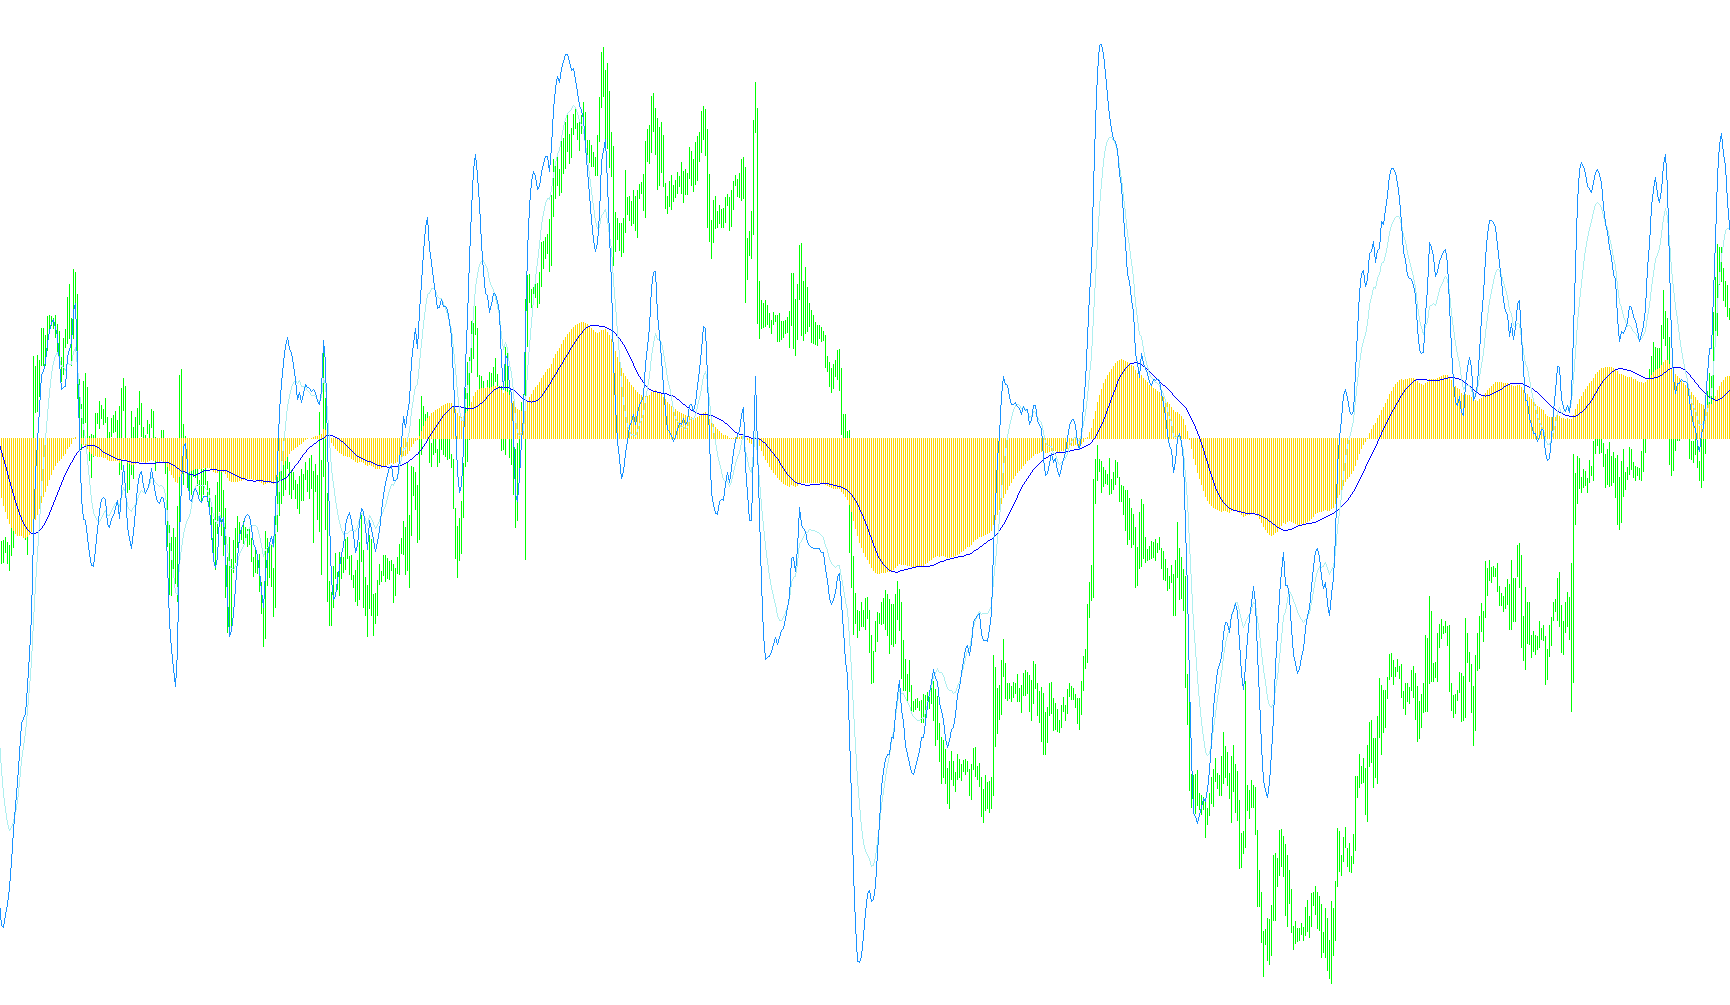
This script is a specialized technical analysis tool designed to track and visualize price momentum by comparing various moving averages. Unlike standard indicators that might use simple formulas, this specific tool employs a multi-layered calculation to help traders identify trends and potential shifts in market sentiment.
Core Logic and Functionality
The tool operates by calculating the difference between "fast" price movements and "slow" price movements. By subtracting a long-term average from a short-term average, it creates a visual representation of whether the current price is accelerating or decelerating relative to its historical norm.
Specifically, the logic breaks down into three primary components:
1. Dual Fast-Moving Analysis The script calculates two distinct "fast" lines. Each one takes a different timeframe of recent price action (defined by user-adjustable periods) and subtracts a very long-term average from it. This allows the tool to show how two different types of short-term momentum are behaving simultaneously compared to the broader market trend.
2. The Momentum Histogram A primary visual element of this script is the histogram. It measures the gap between a medium-term moving average and a long-term moving average. This acts as a "pulse" for the market, showing the immediate strength of a current move. When the histogram moves higher or lower, it indicates that the momentum is gaining or losing steam.
3. The Signal Smoothing (Mid MA) To provide a clearer picture, the script takes the data from the Momentum Histogram and applies an additional smoothing layer. By averaging the histogram values over a specific period, it produces a "signal" line. This helps filter out minor price "noise," making it easier for a user to see the underlying direction of the trend without being distracted by every small fluctuation.
How It Appears on the Chart
The indicator lives in its own separate window below the main price chart. It provides four visual layers:
- A Histogram: Representing the core momentum.
- Three Distinct Lines: Representing different combinations of moving averages (Fast MA 1, Fast MA 2, and the smoothed Mid MA).
By observing where these lines intersect and how the histogram fluctuates, traders can better visualize the relationship between short-term volatility and long-term price trends.
//+------------------------------------------------------------------+
//|   MACD_D3X                                                  MACD |
//+------------------------------------------------------------------+
// This is the correct computation and display of MACD !
// fxtsd.com2007 ki
#property copyright ""
#property link      ""

#property indicator_separate_window
#property indicator_buffers 4
#property indicator_color1 DarkSlateGray
#property indicator_color2 Gold
#property indicator_color3 DodgerBlue
#property indicator_color4 Red
#property indicator_style2 2
#property indicator_level1 0.002
#property indicator_level2 -0.002
#property indicator_levelcolor DarkSlateGray
#property indicator_levelstyle 2

//---- input parameters
extern int       FastMA1Period=5;
extern int       FastMA2Period=13;
extern int       MidMAPeriod =34;
extern int       SlowMAPeriod=55;

//---- buffers
double FastMA1LineBuffer[];
double FastMA2LineBuffer[];
double MidMALineBuffer[];
double MACDLineBuffer[];
double HistogramBuffer[];

//---- variables

//+------------------------------------------------------------------+
//| Custom indicator initialization function                         |
//+------------------------------------------------------------------+
int init()
{
   IndicatorDigits(MarketInfo(Symbol(),MODE_DIGITS)+1);
   //---- indicators
    IndicatorBuffers( 4 );

   SetIndexStyle(3,DRAW_LINE);
   SetIndexBuffer(3,FastMA1LineBuffer);
   SetIndexDrawBegin(3,SlowMAPeriod+MidMAPeriod);

   SetIndexStyle(2,DRAW_LINE);
   SetIndexBuffer(2,FastMA2LineBuffer);
   SetIndexDrawBegin(2,SlowMAPeriod+MidMAPeriod);

   SetIndexStyle(1,DRAW_LINE);
   SetIndexBuffer(1,MidMALineBuffer);
   SetIndexDrawBegin(1,SlowMAPeriod+MidMAPeriod);

   SetIndexStyle(0,DRAW_HISTOGRAM);
   SetIndexBuffer(0,HistogramBuffer);
   SetIndexDrawBegin(0,SlowMAPeriod+MidMAPeriod);
   //---- name for DataWindow and indicator subwindow label
   IndicatorShortName("MACD_D3 ("+FastMA1Period+","+FastMA2Period+","+MidMAPeriod+","+SlowMAPeriod+")");
   SetIndexLabel(1,"MACD_MidMAsig");
   SetIndexLabel(0,"MACD_MidMA");
   SetIndexLabel(2,"MACD_FastMA2");
   SetIndexLabel(3,"MACD_FastMA1");


   //----
   //----
   return(0);
}
//+------------------------------------------------------------------+
//| Custor indicator deinitialization function                       |
//+------------------------------------------------------------------+
int deinit()
{
   //----
   //----
   return(0);
}
//+------------------------------------------------------------------+
//| Custom indicator iteration function                              |
//+------------------------------------------------------------------+
int start()
{
   int limit;
   int counted_bars = IndicatorCounted();
   //---- check for possible errors
   if (counted_bars<0) return(-1);
   //---- last counted bar will be recounted
   if (counted_bars>0) counted_bars--;
   limit = Bars - counted_bars;

   for(int i=limit; i>=0; i--)
   {
      FastMA1LineBuffer[i] = iMA(NULL,0,FastMA1Period,0,MODE_LWMA,PRICE_CLOSE,i) - iMA(NULL,0,SlowMAPeriod,0,MODE_EMA,PRICE_CLOSE,i);
      FastMA2LineBuffer[i] = iMA(NULL,0,FastMA2Period,0,MODE_LWMA,PRICE_CLOSE,i) - iMA(NULL,0,SlowMAPeriod,0,MODE_EMA,PRICE_CLOSE,i);
//      MidMALineBuffer[i] = iMA(NULL,0,MidMAPeriod,0,MODE_EMA,PRICE_CLOSE,i) - iMA(NULL,0,SlowMAPeriod,0,MODE_EMA,PRICE_CLOSE,i);
      HistogramBuffer[i] =  iMA(NULL,0,MidMAPeriod,0,MODE_EMA,PRICE_CLOSE,i) - iMA(NULL,0,SlowMAPeriod,0,MODE_EMA,PRICE_CLOSE,i);
     }
   for(i=limit; i>=0; i--)
     {
     MidMALineBuffer[i] = iMAOnArray(HistogramBuffer,0,13,0,MODE_SMA,i);
//     HistogramBuffer[i] =  iMA(NULL,0,FastMA2Period,0,MODE_EMA,PRICE_CLOSE,i) - iMA(NULL,0,MidMAPeriod,0,MODE_EMA,PRICE_CLOSE,i);
      }

   //----
   return(0);
}
//+------------------------------------------------------------------+
Comments