macd_x2slopeMTF
Download script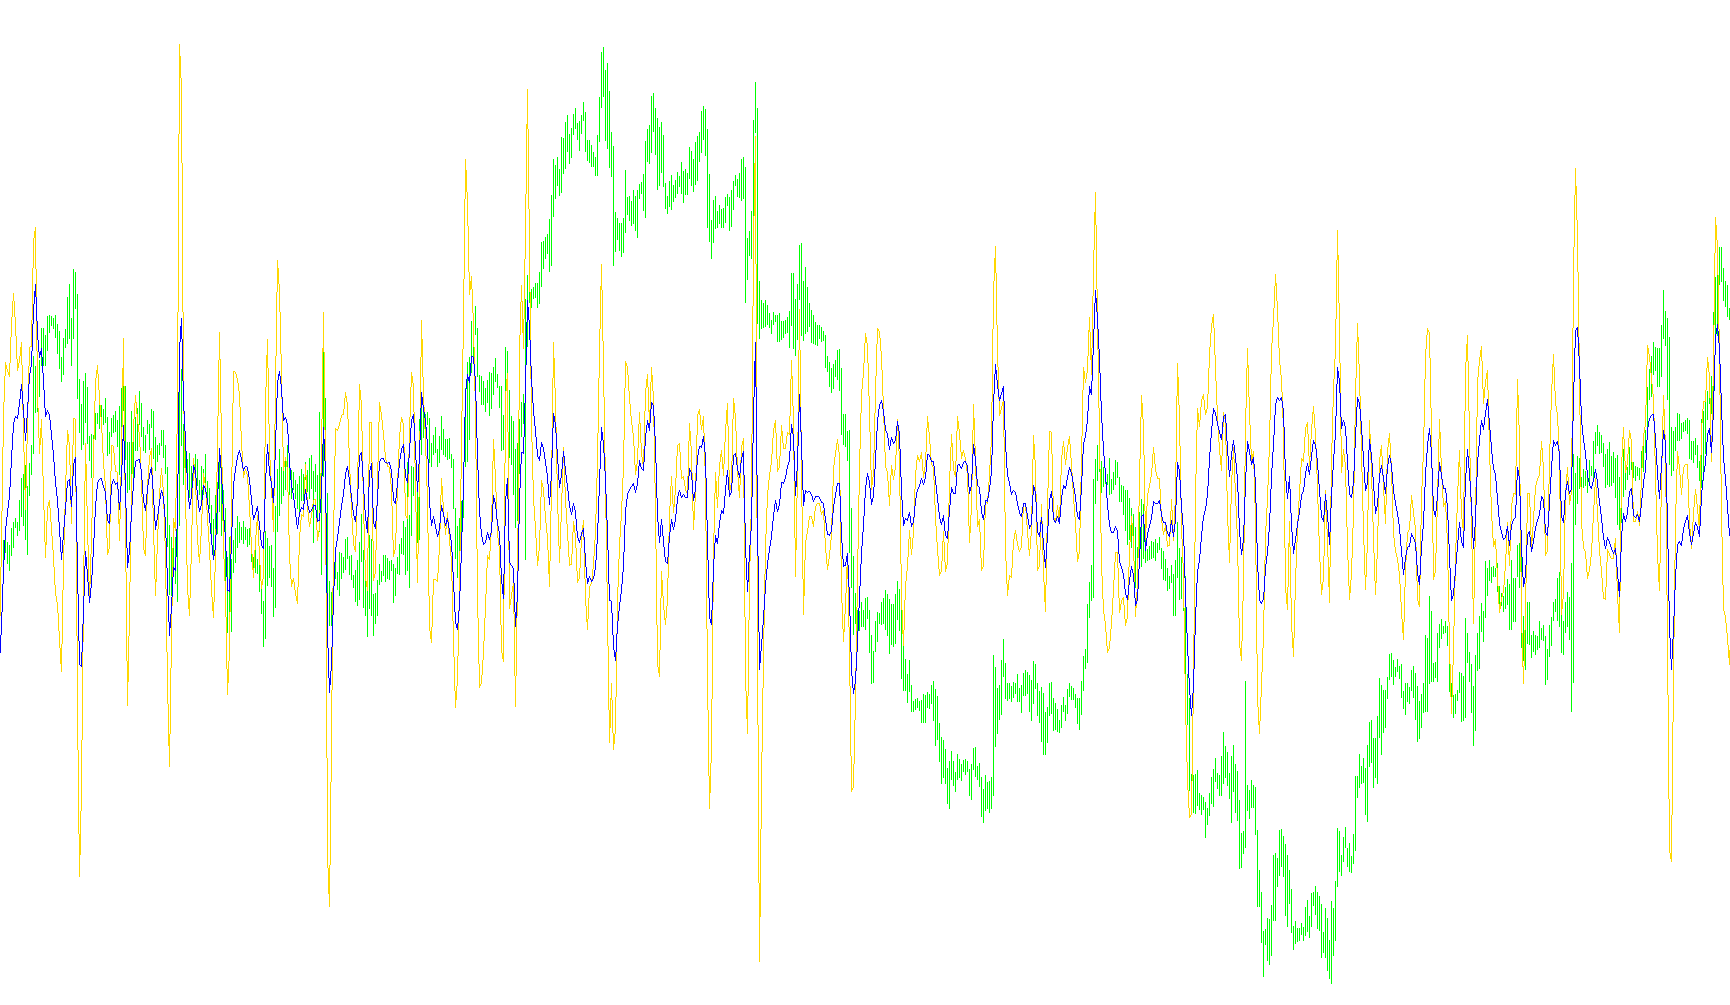
This script is designed as a custom technical analysis tool for the MetaTrader platform. Its primary purpose is to visualize momentum and trend changes by calculating two distinct versions of the MACD (Moving Average Convergence Divergence) indicator simultaneously, with a specific focus on their "slope" or rate of change.
Core Functionality
The script monitors price movements across a user-defined timeframe and processes this data to generate two visual lines on a separate window. Rather than simply showing the standard MACD value, the logic focuses on how much the indicator's value changes over a very short period.
How the Logic Works:
- Dual Multi-Layer Analysis: The tool tracks two independent sets of moving averages. Each set has its own specific speed (Fast, Slow, and Signal periods), allowing users to observe different types of market momentum—for example, one might be tuned for quick, aggressive shifts, while the other focuses on smoother, long-term trends.
- Slope Calculation: The defining characteristic of this script is its "slope" logic. Instead of plotting the raw MACD value, it subtracts a previous value from the current value based on a specific period (the
slopePeriod). This highlights the velocity of the price movement. If the resulting line moves upward, it indicates accelerating momentum; if it moves downward, it suggests decelerating momentum. - Timeframe Compatibility: The script includes logic to ensure that data is correctly synchronized even if you are viewing a smaller timeframe than the one being calculated. It automatically aligns the historical data to ensure the visual lines remain accurate and continuous.
Visual Representation
The tool produces two distinct colored lines on your chart:
- Line 1 (LightSeaGreen): Represents the momentum slope of the first set of MACD parameters.
- Line 2 (Green): Represents the momentum slope of the second set of MACD parameters.
By observing how these two lines interact—crossing each other, diverging, or flattening out—traders can gain a clearer perspective on whether market strength is increasing or weakening across different speeds of analysis.
//+------------------------------------------------------------------+
//|                                                          CCI.mq4 |
//|                      Copyright © 2004, MetaQuotes Software Corp. |
//|                                       http://www.metaquotes.net/ |
//+------------------------------------------------------------------+
//2009fxtsd
#property copyright "Copyright © 2004, MetaQuotes Software Corp."
#property link      "http://www.metaquotes.net/"
//----
#property indicator_separate_window
#property indicator_buffers 2
#property indicator_color1 LightSeaGreen
#property indicator_color2 Green

//---- input parameters
extern int macd1MAfast =5;
extern int macd1MAslow =13;
extern int macd1SigMA  =5;

extern int macd2MAfast =12;
extern int macd2MAslow =26;
extern int macd2SigMA  =9;

extern int macd1LnMode=0;//0main,1sig
extern int macd2LnMode=0;

extern int slopePeriod=2; //0main,1sig
extern int TimeFrame = 0;

//---- buffers
double buffer1[];
double buffer2[];

//+------------------------------------------------------------------+
//| Custom indicator initialization function                         |
//+------------------------------------------------------------------+

int init()
  {
//---- indicator lines

   SetIndexBuffer(0, buffer1);
   SetIndexBuffer(1, buffer2);
//----
//----
   TimeFrame=MathMax(TimeFrame,Period());

//---- name for DataWindow and indicator subwindow label
   string name1= " macd1 ("+macd1MAfast+","+macd1MAslow+","+macd1SigMA+") ";
   string name2= " macd2 ("+macd2MAfast+","+macd2MAslow+","+macd2SigMA+") ";
   string name3= " slope ("+slopePeriod+") ";

   IndicatorShortName(name1+name2+name3+TimeFrame);
   SetIndexLabel(0, name1);
   SetIndexLabel(1, name2);


//----
   return(0);
  }
//+------------------------------------------------------------------+
//| Commodity Channel Index                                          |
//+------------------------------------------------------------------+
int start()
  {
   datetime TimeArray[];
   int    i,limit,y=0,counted_bars=IndicatorCounted();

// Plot defined timeframe on to current timeframe
   ArrayCopySeries(TimeArray,MODE_TIME,Symbol(),TimeFrame);

      limit=Bars-counted_bars;
      if (TimeFrame != Period())
      limit = MathMax(limit,TimeFrame/Period());

   for(i=0,y=0;i<limit;i++)
   {
   if (Time[i]<TimeArray[y]) y++;
//---- main loop

       buffer1[i] = iMACD(NULL,TimeFrame,macd1MAfast,macd1MAslow,macd1SigMA,PRICE_CLOSE,macd1LnMode,y)-
                    iMACD(NULL,TimeFrame,macd1MAfast,macd1MAslow,macd1SigMA,PRICE_CLOSE,macd1LnMode,y+slopePeriod);

       buffer2[i] = iMACD(NULL,TimeFrame,macd2MAfast,macd2MAslow,macd2SigMA,PRICE_CLOSE,macd2LnMode,y)-
                    iMACD(NULL,TimeFrame,macd2MAfast,macd2MAslow,macd2SigMA,PRICE_CLOSE,macd2LnMode,y+slopePeriod);
   }

return(0);

  }
Comments