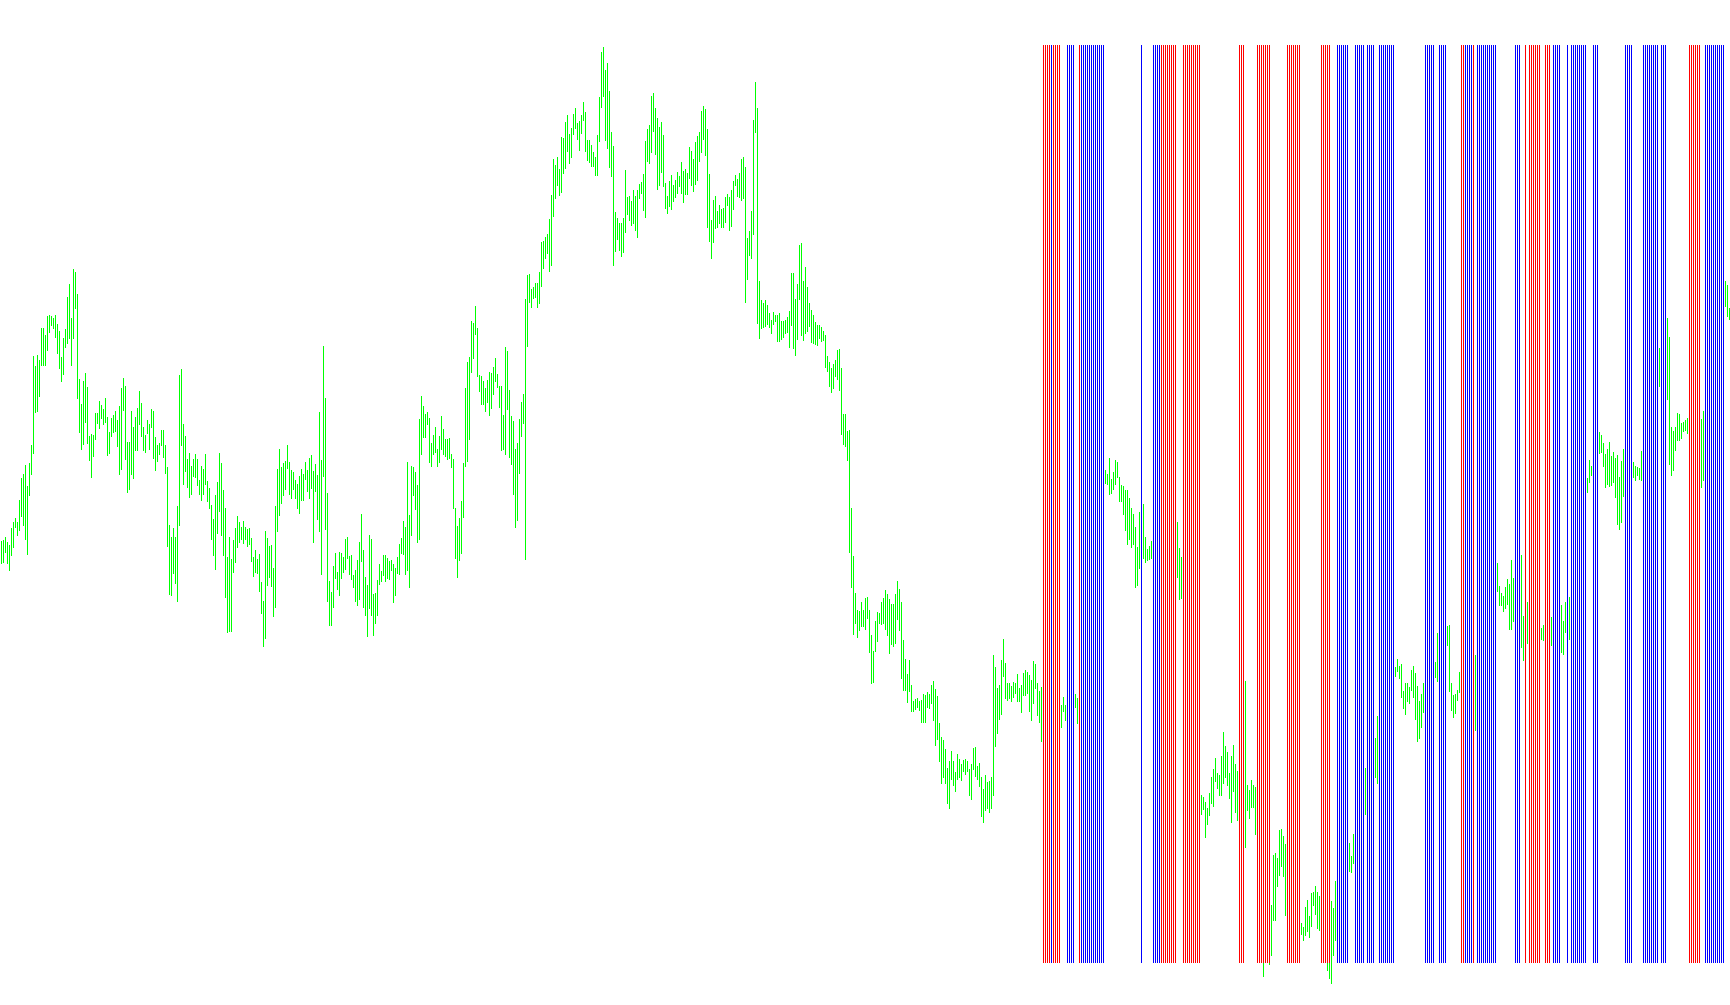
This tool is designed as a visual dashboard for traders who want to identify specific momentum shifts in the market using the MACD (Moving Average Convergence Divergence) technical indicator. It simplifies complex price movements into clear visual signals, helping users spot potential buying and selling opportunities at a glance.
Core Functionality
The script analyzes historical price data based on a timeframe of your choosing (ranging from 1-minute charts to monthly views). It processes the "Main" and "Signal" lines of the MACD to determine when the market momentum is shifting in a way that suggests a potential entry point.
Visual Indicators
The tool provides three distinct visual components in a separate window:
- Blue Signals (Buy Opportunities): The script identifies a "Possible Trade BUY" when the MACD Signal line drops below the Main line while the Main line remains in positive territory. This is represented as a blue histogram.
- Red Signals (Sell Opportunities): Conversely, it identifies a "Possible Trade SELL" when the MACD Signal line climbs above the Main line while the Main line stays in negative territory. These are represented as red histograms.
- Neutral Zones: When neither of the specific buy or sell conditions are met, the tool indicates a neutral state, helping you stay out of "noisy" markets where no clear trend is forming.
Smart Alert System
To ensure you don't have to stare at the screen constantly, the script includes a built-in notification system. When the market meets the criteria for a potential trade on the most recent completed bar:
- Pop-up Alerts: If enabled, the software will trigger a visual alert box naming the specific currency or asset and the type of trade (Buy or Sell).
- Audio Notifications: The script can play unique sound files to differentiate between bullish and bearish signals, allowing you to react to market movements even if you are looking away from your workstation.
Customization for Your Strategy
The tool is highly adaptable to different trading styles. You can customize the historical depth (how many past bars to calculate), toggle the alerts and sounds on or off, and select the specific timeframe that matches your trading personality—whether you are a scalper looking for quick moves or a long-term investor tracking monthly trends.
#property copyright " "
#property link      " "

#property indicator_separate_window
#property indicator_minimum 0
#property indicator_maximum 1
#property indicator_buffers 3
#property indicator_color1 Red
#property indicator_color2 Blue

//---- input parameters
extern string waveb="alert1.wav";
extern string waves="alert2.wav";
extern int Minutes=0;
extern int BarsToCount = 300;
extern bool Alerts_On = false;
extern bool Sound_Alert = true;
//---- buffers
double ExtMapBuffer1[];
double ExtMapBuffer2[];
double ExtMapBuffer3[];
string TimeFrameStr;
string TradeMsg;
double MACD_Signal,MACD_Main;
//+------------------------------------------------------------------+
//| Custom indicator initialization function                         |
//+------------------------------------------------------------------+
int init()
  {
//---- indicators
  SetIndexStyle(0,DRAW_HISTOGRAM,STYLE_SOLID,1,Red);
  SetIndexBuffer(0,ExtMapBuffer1);
  SetIndexStyle(1,DRAW_HISTOGRAM,STYLE_SOLID,1, Blue);
  SetIndexBuffer(1,ExtMapBuffer2);

switch(Minutes)
   {
      case 1 : TimeFrameStr="Period_M1"; break;
      case 5 : TimeFrameStr="Period_M5"; break;
      case 15 : TimeFrameStr="Period_M15"; break;
      case 30 : TimeFrameStr="Period_M30"; break;
      case 60 : TimeFrameStr="Period_H1"; break;
      case 240 : TimeFrameStr="Period_H4"; break;
      case 1440 : TimeFrameStr="Period_D1"; break;
      case 10080 : TimeFrameStr="Period_W1"; break;
      case 43200 : TimeFrameStr="Period_MN1"; break;
      default : TimeFrameStr="Current Timeframe"; Minutes=0;
   }
   IndicatorShortName("MACD Entry ("+TimeFrameStr+")");


//----
   return(0);
  }
//+------------------------------------------------------------------+
//| Custom indicator deinitialization function                       |
//+------------------------------------------------------------------+
int deinit()
  {
//----

//----
   return(0);
  }
//+------------------------------------------------------------------+
//| Custom indicator iteration function                              |
//+------------------------------------------------------------------+
int start()
  {
   int    counted_bars=IndicatorCounted();
//----

for (int i = 0; i < BarsToCount; i++){
   ExtMapBuffer1[i]=0;
   ExtMapBuffer2[i]=0;
   ExtMapBuffer3[i]=0;


   MACD_Signal=iMACD(NULL,Minutes,5,34,5,PRICE_CLOSE,MODE_SIGNAL,i);
   MACD_Main  =iMACD(NULL,Minutes,5,34,5,PRICE_CLOSE,MODE_MAIN,i);

   if(MACD_Signal < MACD_Main && MACD_Main > 0)ExtMapBuffer2[i] = 1;

   if(MACD_Signal > MACD_Main && MACD_Main < 0)ExtMapBuffer1[i] = 1;

   if(ExtMapBuffer1[i] == 0 && ExtMapBuffer2[i] == 0)
    {ExtMapBuffer3[i] = 1;}


 // -- There the code I put for alert.
 // -- But run on each ticks.

  if (Alerts_On && i == 1 &&  (ExtMapBuffer2[i]) > 0)
  Alert("Check ",Symbol()," Possible Trade BUY");
  if(Sound_Alert && i == 1 &&  (ExtMapBuffer2[i]) > 0) PlaySound(waveb);

  if (Alerts_On && i == 1 &&  (ExtMapBuffer1[i]) > 0)
  Alert("Check ",Symbol()," Possible Trade SELL");
  if(Sound_Alert && i == 1 &&  (ExtMapBuffer1[i]) > 0) PlaySound(waves);


}


//----
   return(0);
  }
//+------------------------------------------------------------------+
Comments