MACD_color_new
Download script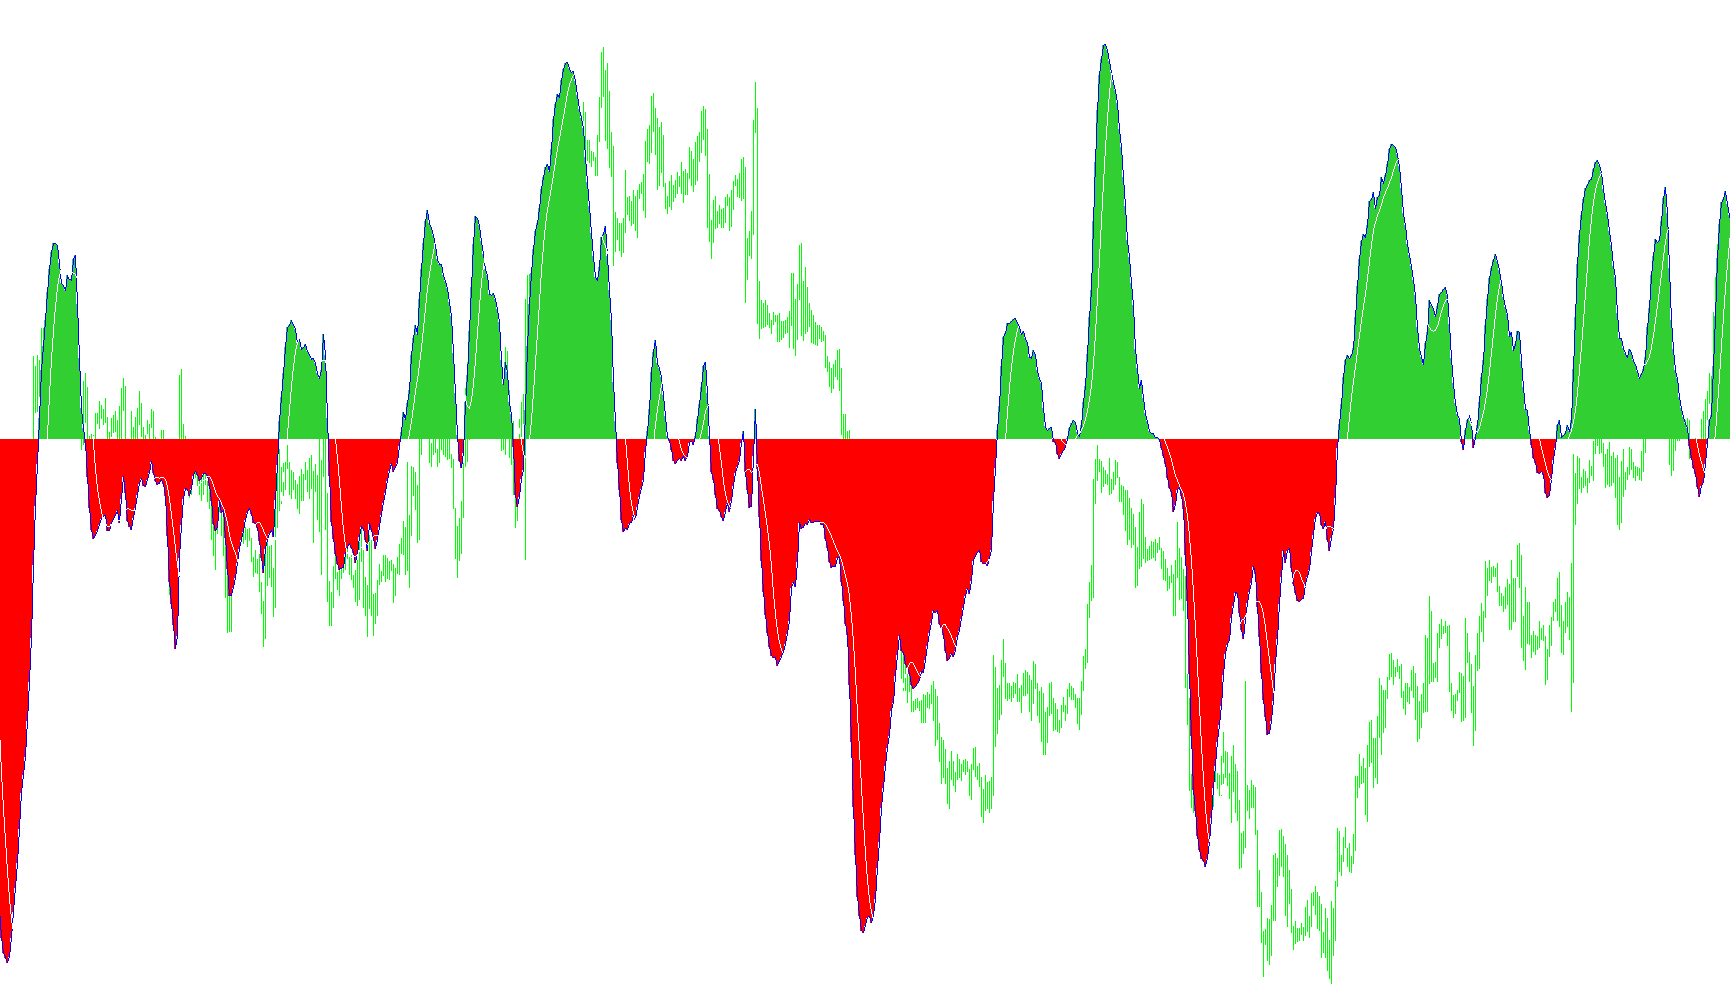
The MACD Color indicator is a visual trading tool designed to provide clarity on market momentum by interpreting the standard Moving Average Convergence Divergence (MACD) data through dynamic color coding. While a standard MACD can sometimes be difficult to read at a glance, this script simplifies the interpretation of price trends by highlighting the direction of movement in real-time.
Core Logic and Functionality
The indicator operates based on three primary components: a Fast Exponential Moving Average (EMA), a Slow Exponential Moving Average (EMA), and a Signal Simple Moving Average (SMA). Here is how the logic processes these elements to create the visual output:
- Momentum Calculation: The tool first calculates the distance between the Fast EMA and the Slow EMA. This difference represents the "momentum" of the asset—essentially showing whether the short-term price trend is pulling away from or moving toward the long-term average.
- Dynamic Color Coding: Unlike a standard histogram that remains a single color, this script evaluates the relationship between the current momentum value and the previous one. It assigns specific colors based on these shifts:
- Bullish Movement: When the momentum is positive and increasing (moving higher), the indicator uses a distinct color (Lime Green) to signal upward strength.
- Bearish Movement: When the momentum is negative and decreasing (moving lower), it utilizes another color (Red) to signal downward strength.
- Trend Reversals: The logic specifically identifies when the momentum begins to "hook" or turn. If the value is still negative but starting to rise, or if it is positive but starting to fall, the colors shift accordingly to alert the user that the current trend may be losing steam or reversing.
- Signal Smoothing: In addition to the color-coded histogram, the script calculates a "Signal Line." This is a smoothed average of the momentum values themselves, providing a secondary layer of data to help identify major trend shifts and potential entry or exit points.
How it Benefits the Trader
By transforming raw numerical data into a color-coded visual, this indicator allows you to:
- Identify Trend Strength: Quickly see if a move is accelerating or decelerating based on color changes.
- Spot Potential Reversals: Recognize early signs of exhaustion in a trend before they become obvious on the price chart.
- Simplify Analysis: Reduce the cognitive load required to interpret standard MACD lines, allowing for faster decision-making during live market sessions.
Indicators Used
Miscellaneous
10
Views
1
Downloads
0
Favorites
MACD_color_new
/*

*********************************************************************

                            MACD Color
                   Copyright © 2006  Akuma99
                  http://www.beginnertrader.com/

       For help on this indicator, tutorials and information
               visit http://www.beginnertrader.com/

*********************************************************************

*/

#property  copyright "Copyright © 2006, Akuma99."
#property  link      "http://www.beginnertrader.com/"

#property  indicator_separate_window
#property  indicator_buffers 6
#property  indicator_color1  Red
#property  indicator_color2  LimeGreen
#property  indicator_color3  Red
#property  indicator_color4  LimeGreen
#property  indicator_color5  Blue
#property  indicator_color6  Black

extern int FastEMA=12;
extern int SlowEMA=26;
extern int SignalSMA=9;

double     ind_buffer1[];
double     ind_buffer2[];
double     ind_buffer1b[];
double     ind_buffer2b[];
double     ind_buffer3[];
double     ind_buffer4[];

double     b[999999];

int init() {

   SetIndexStyle(0,DRAW_HISTOGRAM,STYLE_SOLID,2,indicator_color1);
   SetIndexStyle(1,DRAW_HISTOGRAM,STYLE_SOLID,2,indicator_color2);
   SetIndexStyle(2,DRAW_HISTOGRAM,STYLE_SOLID,2,indicator_color3);
   SetIndexStyle(3,DRAW_HISTOGRAM,STYLE_SOLID,2,indicator_color4);
   SetIndexStyle(4,DRAW_LINE,EMPTY,1,indicator_color5);
   SetIndexStyle(5,DRAW_LINE,EMPTY,1,indicator_color6);
   SetIndexBuffer(0,ind_buffer1);
   SetIndexBuffer(1,ind_buffer2);
   SetIndexBuffer(2,ind_buffer1b);
   SetIndexBuffer(3,ind_buffer2b);
   SetIndexBuffer(4,ind_buffer3);
   SetIndexBuffer(5,ind_buffer4);

   IndicatorDigits(MarketInfo(Symbol(),MODE_DIGITS)+1);

   return(0);

}

int start(){

   int limit;
   int counted_bars=IndicatorCounted();

   if(counted_bars<0) return(-1);

   if(counted_bars>0) counted_bars--;
   limit=Bars-counted_bars;

   for(int i=limit; i>=0; i--) {

      b[i] = iMA(NULL,0,FastEMA,0,MODE_EMA,PRICE_CLOSE,i)-iMA(NULL,0,SlowEMA,0,MODE_EMA,PRICE_CLOSE,i);
      ind_buffer1[i]=iMA(NULL,0,FastEMA,0,MODE_EMA,PRICE_CLOSE,i)-iMA(NULL,0,SlowEMA,0,MODE_EMA,PRICE_CLOSE,i);

      clearBuffers(i);

      if (b[i] < 0 ) {
         if (b[i] > b[i+1]) {
            ind_buffer1[i] = b[i];
            ind_buffer1b[i] = 0;
         } else if (b[i] < b[i+1]) {
            ind_buffer1b[i] = b[i];
            ind_buffer1[i] = 0;
         }
      } else if (b[i] > 0) {
          if (b[i] < b[i+1]) {
            ind_buffer2[i] = b[i];
            ind_buffer2b[i] = 0;
         } else if (b[i] > b[i+1]) {
            ind_buffer2b[i] = b[i];
            ind_buffer2[i] = 0;
         }
      }

      ind_buffer3[i]=iMA(NULL,0,FastEMA,0,MODE_EMA,PRICE_CLOSE,i)-iMA(NULL,0,SlowEMA,0,MODE_EMA,PRICE_CLOSE,i);

   }

   for(i=0; i<limit; i++) {
         ind_buffer4[i]=iMAOnArray(ind_buffer3,Bars,SignalSMA,0,MODE_SMA,i);
      }

   return(0);

}

void clearBuffers (int i) {

      ind_buffer1[i] = NULL;
      ind_buffer1b[i] = NULL;
      ind_buffer2[i] = NULL;
      ind_buffer2b[i] = NULL;

}
Comments