MACD_v1
Download script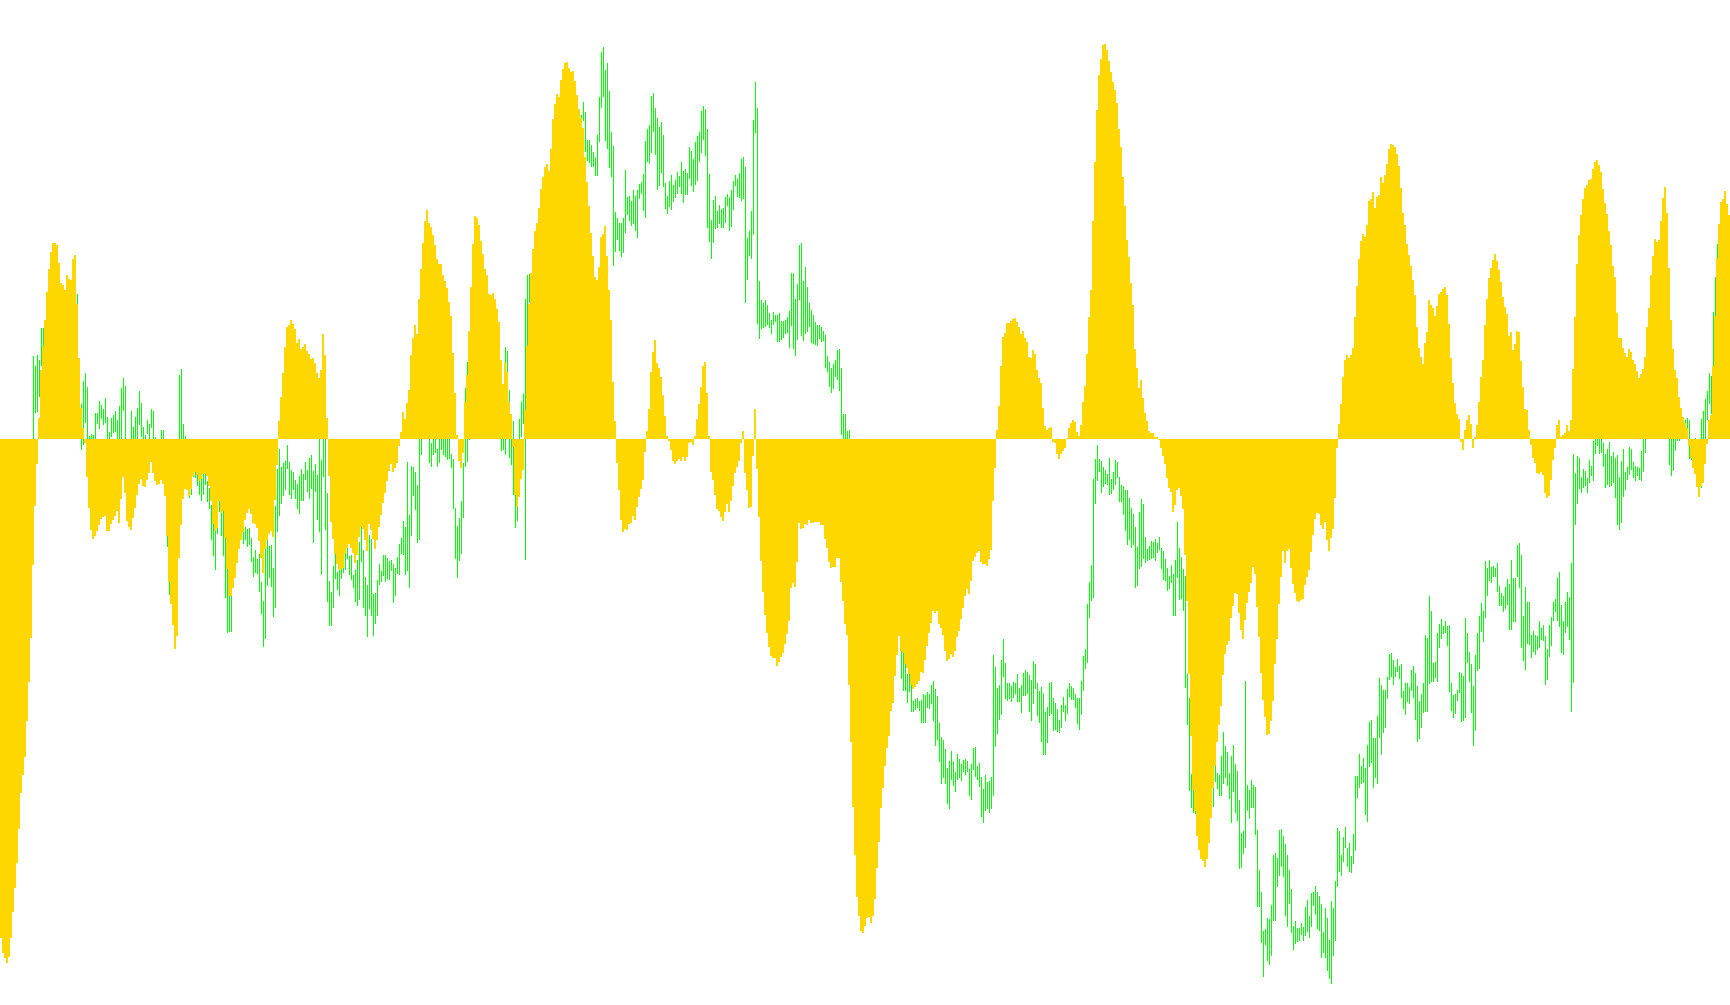
Overview of the Custom MACD Indicator
This script is designed to provide a visual analysis of market momentum by calculating two primary components: the MACD line and the Signal line. It helps traders identify trends and potential turning points by measuring the relationship between different price averages over specific timeframes.
Core Logic and Methodology
The indicator operates through a three-step mathematical process to generate its visuals:
1. Determining Price Velocity (The Fast and Slow Averages) The logic begins by tracking two different "Moving Averages" of the market's closing prices.
- A Fast Moving Average is calculated using a shorter period, making it more responsive to recent price changes.
- A Slow Moving Average is calculated using a longer period, which provides a smoother view of the broader trend.
2. Calculating the MACD Line The script then calculates the difference between these two moving averages. By subtracting the Slow Moving Average from the Fast Moving Average, the indicator produces the MACD value.
- When the fast average is significantly higher than the slow average, it suggests upward momentum.
- When the fast average falls below the slow average, it indicates downward pressure. This value is displayed on your chart as a histogram, allowing you to see the magnitude of the price's momentum at any given moment.
3. Generating the Signal Line To help filter out market "noise" and provide a clearer picture of trend changes, the script performs one final calculation. It takes the history of the MACD values generated in the previous step and calculates a Simple Moving Average of those values. This resulting Signal Line acts as a baseline; traders often look for the moment the histogram crosses this signal line to identify potential entries or exits in the market.
User Customization
The script is built with adjustable parameters, allowing you to define the specific sensitivity of the indicator:
- FastEMA: Determines how quickly the indicator reacts to new price data.
- SlowEMA: Determines the length of the broader trend analysis.
- SignalSMA: Controls the smoothing of the signal line to help distinguish between minor fluctuations and significant trend shifts.
//+------------------------------------------------------------------+
//|                                                  Custom MACD.mq4 |
//|                      Copyright © 2004, MetaQuotes Software Corp. |
//|                                       http://www.metaquotes.net/ |
//+------------------------------------------------------------------+
#property  copyright "Copyright © 2004, MetaQuotes Software Corp."
#property  link      "http://www.metaquotes.net/"
//---- indicator settings
#property  indicator_separate_window
#property  indicator_buffers 2
#property  indicator_color1  Silver
#property  indicator_color2  Red
//---- indicator parameters
extern int FastEMA=12;
extern int SlowEMA=26;
extern int SignalSMA=9;
//---- indicator buffers
double     ind_buffer1[];
double     ind_buffer2[];

//+------------------------------------------------------------------+
//| Custom indicator initialization function                         |
//+------------------------------------------------------------------+
int init()
  {
//---- drawing settings
   SetIndexStyle(0,DRAW_HISTOGRAM,STYLE_SOLID,3);
   SetIndexDrawBegin(1,SignalSMA);
   IndicatorDigits(MarketInfo(Symbol(),MODE_DIGITS)+1);
//---- indicator buffers mapping
   if(!SetIndexBuffer(0,ind_buffer1) && !SetIndexBuffer(1,ind_buffer2))
      Print("cannot set indicator buffers!");
//---- name for DataWindow and indicator subwindow label
   IndicatorShortName("MACD("+FastEMA+","+SlowEMA+","+SignalSMA+")");
   SetIndexLabel(0,"MACD");
   SetIndexLabel(1,"Signal");
//---- initialization done
   return(0);
  }
//+------------------------------------------------------------------+
//| Moving Averages Convergence/Divergence                           |
//+------------------------------------------------------------------+
int start()
  {
   int limit;
   int counted_bars=IndicatorCounted();
//---- check for possible errors
   if(counted_bars<0) return(-1);
//---- last counted bar will be recounted
   if(counted_bars>0) counted_bars--;
   limit=Bars-counted_bars;
//---- macd counted in the 1-st buffer
   for(int i=0; i<limit; i++)
      ind_buffer1[i]=iMA(NULL,0,FastEMA,0,MODE_EMA,PRICE_CLOSE,i)-iMA(NULL,0,SlowEMA,0,MODE_EMA,PRICE_CLOSE,i);
//---- signal line counted in the 2-nd buffer
   for(i=0; i<limit; i++)
      ind_buffer2[i]=iMAOnArray(ind_buffer1,Bars,SignalSMA,0,MODE_SMA,i);
//---- done
   return(0);
  }
Comments