MACD_ColorHist_Alert LA 5
Download script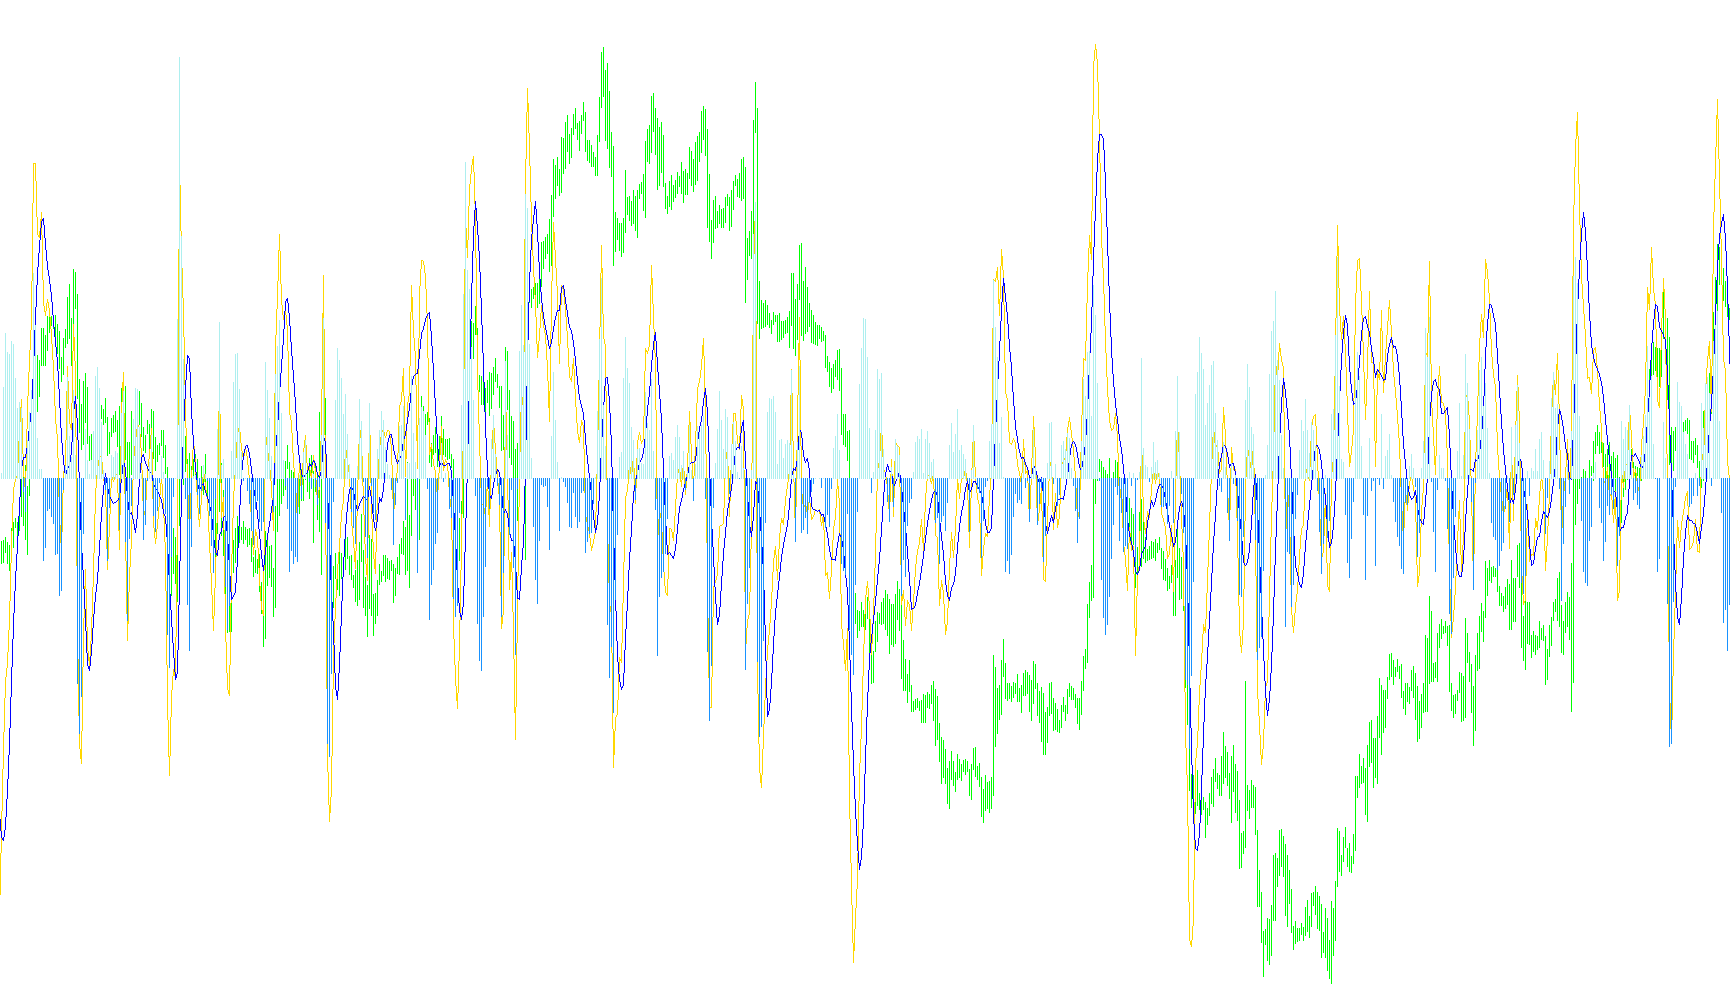
This script is a customized technical analysis tool designed for the MetaTrader platform to help traders visualize momentum and identify specific trend reversals in the financial markets. It enhances the traditional Moving Average Convergence Divergence (MACD) indicator by adding visual clarity through color-coding and automated notifications.
Core Functionality
The logic operates by calculating three primary components on your trading chart:
- The MACD Line: The script calculates the difference between two moving averages—a "fast" average and a "slow" average. This helps determine the immediate momentum of a price trend.
- The Signal Line: It takes the MACD line and applies a third moving average to it. This creates a smoothed secondary line used to identify potential turning points.
- The Dynamic Histogram: Instead of a simple bar chart, this script calculates the distance between the MACD Line and the Signal Line.
Visual Logic and Color Coding
The tool is designed to provide an immediate visual cue regarding market sentiment:
- When the MACD Line is above the Signal Line, the histogram reflects positive momentum.
- When the MACD Line falls below the Signal Line, the histogram reflects negative momentum.
- By differentiating these states into distinct colors (such as Lime for upward movement and Red for downward movement), the tool allows you to see at a glance whether the current trend is strengthening or weakening.
Automated Alerts and Notifications
Beyond just visual data, the script acts as an active monitoring system. It constantly scans the most recent price action to detect "crosses"—the specific moment when the MACD Line moves from below to above the Signal Line (or vice versa).
When these crossovers occur, the script is programmed to trigger two types of alerts based on your preferences:
- Audio Alerts: An immediate sound notification played on your computer to grab your attention during live trading.
- Email Notifications: If enabled, the script will automatically send a detailed email containing the specific time, the asset symbol, and the current price at the moment the crossover occurred.
Summary for the User
Think of this tool as an automated "trend scout." It simplifies complex mathematical averages into a color-coded visual map, highlighting exactly when momentum is shifting. By providing both a clear visual distinction between bullish and bearish movements and sending real-time alerts, it ensures that you can stay informed about market changes without having to watch the charts every second.
//+------------------------------------------------------------------+
//|                                         MACD_ColorHist_Alert.mq4 |
//|                                    Copyright © 2006, Robert Hill |
//|                                                                  |
//+------------------------------------------------------------------+
#property  copyright "Copyright © 2006, Robert Hill"
//---- indicator settings
#property  indicator_separate_window
#property  indicator_buffers 4
#property  indicator_color1  Aqua
#property  indicator_color2  Yellow
#property  indicator_color3  Lime
#property  indicator_color4  Red

//---- indicator parameters

extern bool SoundON=true;
extern bool EmailON=false;

extern int FastEMA=2;
extern int SlowEMA=8;
extern int SignalSMA=6;
//---- indicator buffers
double     ind_buffer1[];
double     ind_buffer2[];
double HistogramBufferUp[];
double HistogramBufferDown[];
int flagval1 = 0;
int flagval2 = 0;
//---- variables

//+------------------------------------------------------------------+
//| Custom indicator initialization function                         |
//+------------------------------------------------------------------+
int init()
  {
//---- drawing settings
//   IndicatorBuffers(3);
   IndicatorDigits(MarketInfo(Symbol(),MODE_DIGITS)+1);
   SetIndexStyle(0,DRAW_LINE,STYLE_SOLID);
   SetIndexBuffer(0,ind_buffer1);
   SetIndexDrawBegin(0,SlowEMA);
   SetIndexStyle(1,DRAW_LINE,STYLE_SOLID);
   SetIndexBuffer(1,ind_buffer2);
   SetIndexDrawBegin(1,SignalSMA);
   SetIndexStyle(2,DRAW_HISTOGRAM,STYLE_SOLID);
   SetIndexBuffer(2,HistogramBufferUp);
   SetIndexStyle(3,DRAW_HISTOGRAM,STYLE_SOLID);
   SetIndexBuffer(3,HistogramBufferDown);
//   SetIndexDrawBegin(2,SlowEMA + SignalSMA);
//---- name for DataWindow and indicator subwindow label
   IndicatorShortName("MACD("+FastEMA+","+SlowEMA+","+SignalSMA+")");
   SetIndexLabel(0,"MACD");
   SetIndexLabel(1,"Signal");
   SetIndexLabel(2,"Histogram");

//---- initialization done
   return(0);
  }
//+------------------------------------------------------------------+
//| Moving Averages Convergence/Divergence                           |
//+------------------------------------------------------------------+
int start()
  {
   int limit;
   double temp;

   int counted_bars=IndicatorCounted();
//---- check for possible errors
   if(counted_bars<0) return(-1);
//---- last counted bar will be recounted
   if(counted_bars>0) counted_bars--;
   limit=Bars-counted_bars;
//---- macd counted in the 1-st buffer
   for(int i=0; i<limit; i++)
      ind_buffer1[i]=iMA(NULL,0,FastEMA,0,MODE_EMA,PRICE_CLOSE,i)-iMA(NULL,0,SlowEMA,0,MODE_EMA,PRICE_CLOSE,i);
//---- signal line counted in the 2-nd buffer
   for(i=0; i<limit; i++)
      ind_buffer2[i]=iMAOnArray(ind_buffer1,Bars,SignalSMA,0,MODE_SMA,i);
//      ind_buffer2[i] = alpha*ind_buffer1[i] + alpha_1*ind_buffer2[i+1];

   for(i=0; i<limit; i++)
   {
      HistogramBufferUp[i] = 0;
      HistogramBufferDown[i] = 0;
      temp = ind_buffer1[i] - ind_buffer2[i];
      if (temp >= 0)
        HistogramBufferUp[i] = temp;
      else
        HistogramBufferDown[i] = temp;

      if (i == 1)
      {
        if (HistogramBufferUp[i] > 0 && HistogramBufferDown[i + 1] < 0)
//        if (HistogramBufferUp[i] >  HistogramBufferUp[i + 1])
        {
// Cross up
         if (flagval1==0)
         {
           flagval1=1;
           flagval2=0;
           if (SoundON) Alert ("Macd Cross Up! ",Symbol()," ",Period()," @ ",Bid);
                if (EmailON) SendMail("MACD Crossed up", "MACD Crossed up, Date="+TimeToStr(CurTime(),TIME_DATE)+" "+TimeHour(CurTime())+":"+TimeMinute(CurTime())+" Symbol="+Symbol()+" Period="+Period());
         }
        }
        else if (HistogramBufferDown[i] < 0 && HistogramBufferUp[i + 1] > 0)
//        else if (HistogramBufferUp[i] <  HistogramBufferUp[i + 1] )
        {
// Cross down
         if (flagval2==0)
         {
          flagval2=1;
          flagval1=0;
          if (SoundON) Alert ("Macd Cross Down! " ,Symbol()," ",Period()," @ ",Bid);
               if (EmailON) SendMail("MACD Crossed down","MACD Crossed Down, Date="+TimeToStr(CurTime(),TIME_DATE)+" "+TimeHour(CurTime())+":"+TimeMinute(CurTime())+" Symbol="+Symbol()+" Period="+Period());
         }
        }
      }

   }

//---- done
   return(0);
  }
Comments