MACD_H4_300_v100
Download script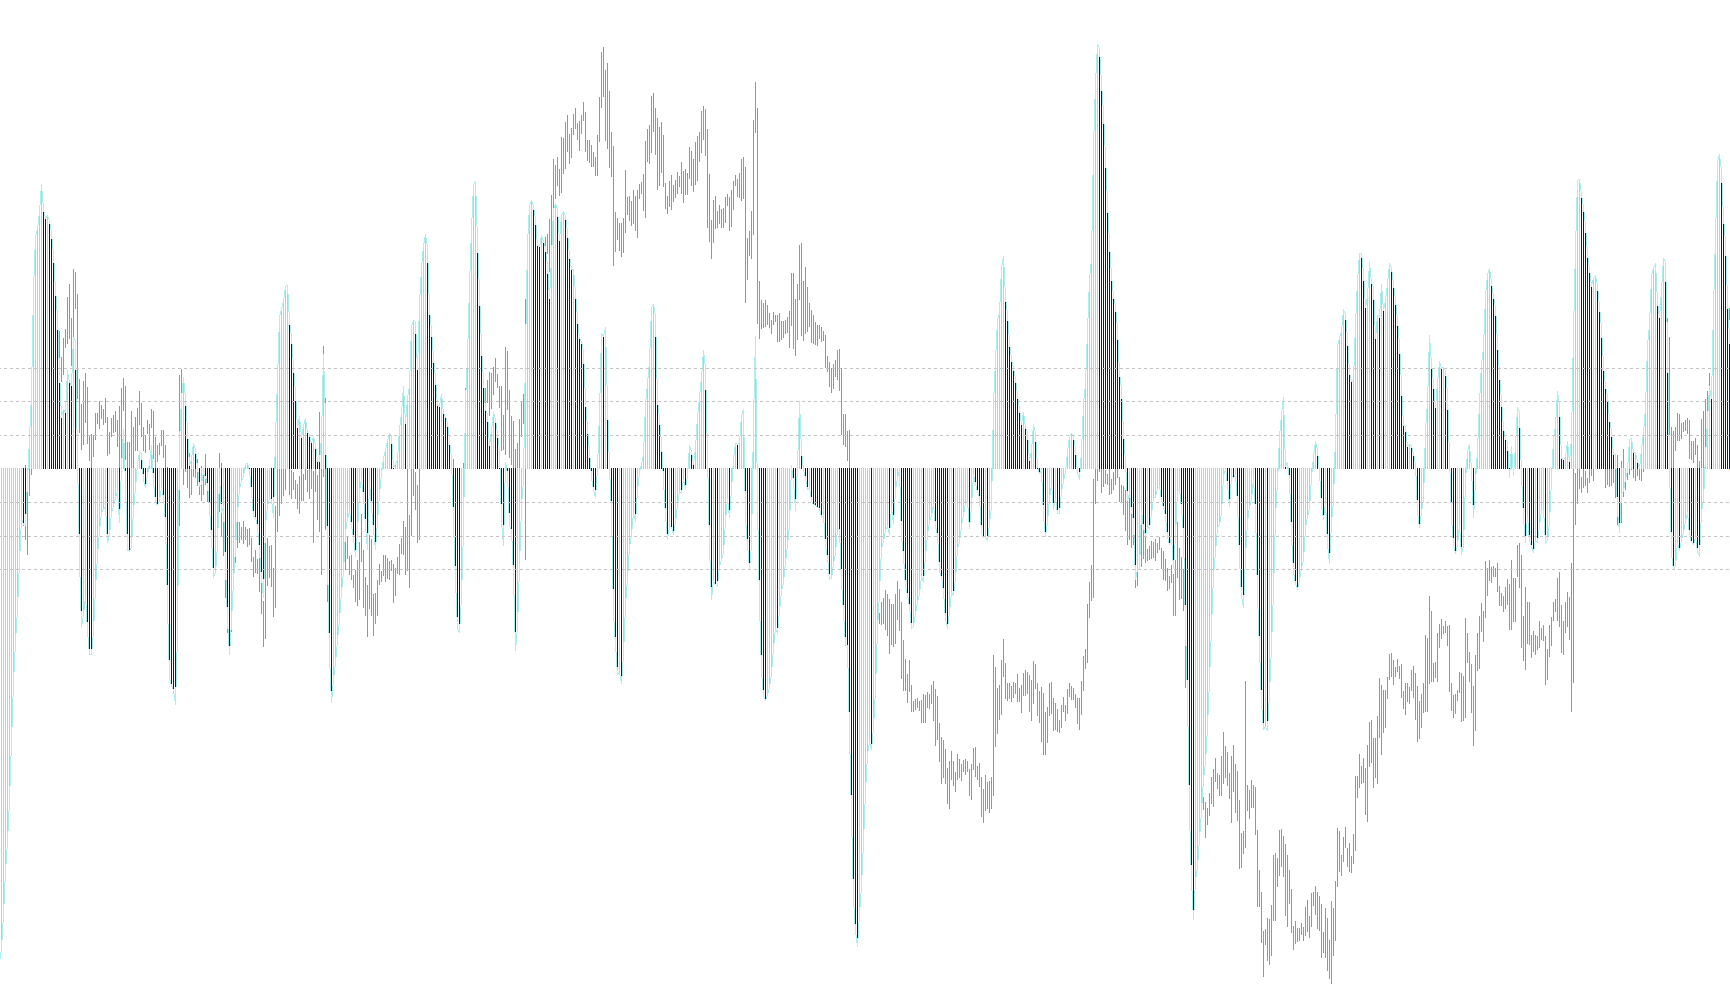
This custom MACD (Moving Average Convergence Divergence) tool is designed to provide traders with a visual representation of momentum and trend direction by analyzing price movement trends. Unlike standard indicators that may only show a single line, this script breaks down the data into distinct visual components to help identify specific market shifts more clearly.
Core Logic and Functionality
The tool operates through three primary mathematical layers:
1. Trend Comparison (The Foundation) The script begins by calculating two different types of Exponential Moving Averages (EMA) based on user-defined speeds. By subtracting the slower moving average from the faster one, the tool determines the "gap" between short-term and long-term price trends. This gap represents the momentum of the market; a widening gap suggests strengthening momentum, while a narrowing gap suggests a potential loss of steam.
2. Directional Filtering (The Histogram) One of the unique features of this specific script is how it handles the visual output. Instead of showing one continuous histogram, the logic inspects the trend data to determine its direction relative to previous points.
- If the momentum is currently higher than the preceding period, the script assigns the value to an "Up" buffer, typically visualized in green.
- If the momentum is lower than the preceding period, it assigns the value to a "Down" buffer, typically visualized in red. This allows traders to immediately distinguish between bullish and bearish momentum at a glance.
3. The Signal Line (The Smoothing Layer) To filter out "noise" and provide a clearer picture of the overall trend, the script applies a third layer: a Simple Moving Average (SMA) calculated based on the results of the MACD values. This creates a "Signal Line," which acts as a smoothed baseline. Traders often look for the interaction between the histograms and this signal line to identify potential turning points or entry signals.
Visual Aids and Reference Levels
To assist with objective analysis, the script incorporates several pre-defined horizontal reference levels (such as 45, 30, 15, -15, -30, and -45). These act as boundaries on the indicator window, helping users identify overbought or oversold conditions and providing a consistent scale to measure the intensity of price swings.
Summary for the User
In plain terms, this script takes raw price data, calculates how fast the price is moving compared to its recent history, and then separates those movements into distinct green and red bars. It finishes by drawing a smooth signal line over those bars, allowing you to see not just where the price is going, but the strength and direction of that movement.
//+------------------------------------------------------------------+
//|                                                  Custom MACD.mq4 |
//+------------------------------------------------------------------+
#property  copyright "Copyright © 2007, Igor Morozov"
#property  link      "http://www.herbspirit.com/mql"
//---- indicator settings
#property  indicator_separate_window
#property  indicator_buffers 3
#property  indicator_color1  Lime
#property  indicator_color2  Red
#property  indicator_color3  Silver
#property  indicator_style3  STYLE_DOT
#property  indicator_level1  45
#property  indicator_level2  30
#property  indicator_level3  15
#property  indicator_level4  -15
#property  indicator_level5  -30
#property  indicator_level6  -45
#property  indicator_levelcolor  Gray
#property  indicator_levelstyle  STYLE_DOT
//---- indicator parameters
extern int FastEMA=5;
extern int SlowEMA=13;
extern int SignalSMA=1;
//---- indicator buffers
double     MacdBuffer[];
double     MacdBufferUp[];
double     MacdBufferDn[];
double     SignalBuffer[];

//+------------------------------------------------------------------+
//| Custom indicator initialization function                         |
//+------------------------------------------------------------------+
int init()
  {
//---- drawing settings
   SetIndexStyle(0,DRAW_HISTOGRAM);
   SetIndexStyle(1,DRAW_HISTOGRAM);
   SetIndexStyle(2,DRAW_LINE);
   SetLevelValue(0,45);
   SetLevelValue(1,30);
   SetLevelValue(2,15);
   SetLevelValue(3,-15);
   SetLevelValue(4,-30);
   SetLevelValue(5,-45);
   SetIndexDrawBegin(1,SignalSMA);
   IndicatorDigits(Point+1);
//---- indicator buffers mapping
   SetIndexBuffer(0,MacdBufferUp);
   SetIndexBuffer(1,MacdBufferDn);
   SetIndexBuffer(2,SignalBuffer);
//---- name for DataWindow and indicator subwindow label
   IndicatorShortName("MACD H4-300("+FastEMA+","+SlowEMA+","+SignalSMA+")");
   SetIndexLabel(0,"MACD UP");
   SetIndexLabel(1,"MACD DN");
   SetIndexLabel(2,"Signal");
//---- initialization done
   return(0);
  }
//+------------------------------------------------------------------+
//| Moving Averages Convergence/Divergence                           |
//+------------------------------------------------------------------+
int start()
  {
   int limit;
   int counted_bars=IndicatorCounted();
//---- last counted bar will be recounted
   if(counted_bars>0) counted_bars--;
   limit=Bars-counted_bars;
   int macdlimit=limit;
   if(macdlimit<Bars-5)
   	macdlimit+=5;
   ArrayResize(MacdBuffer,macdlimit);
   ArraySetAsSeries(MacdBuffer,true);
//---- macd counted in the 1-st buffer
   for(int i=0; i<macdlimit; i++) {
      MacdBuffer[i]=(iMA(NULL,0,FastEMA,0,MODE_EMA,PRICE_CLOSE,i)-
      		iMA(NULL,0,SlowEMA,0,MODE_EMA,PRICE_CLOSE,i))/Point;
//      Print("MACDBUFFER=",MacdBuffer[i]);
   }
   for(i=0;i<limit;i++)
   {
   	int j=i+1;
   	while(MacdBuffer[i]==MacdBuffer[j]&&j-i<=5)
   		j++;
   	if(MacdBuffer[i]>MacdBuffer[j])
   	{
   		MacdBufferUp[i]=MacdBuffer[i];
   		MacdBufferDn[i]=0;
   	}
   	else
   	{
   		MacdBufferDn[i]=MacdBuffer[i];
   		MacdBufferUp[i]=0;
   	}
   }
//---- signal line counted in the 2-nd buffer
   for(i=0; i<limit; i++)
      SignalBuffer[i]=iMAOnArray(MacdBuffer,Bars,SignalSMA,0,MODE_SMA,i);
//---- done
   return(0);
  }
//+------------------------------------------------------------------+
Comments