MACD_Signal_v3
Download script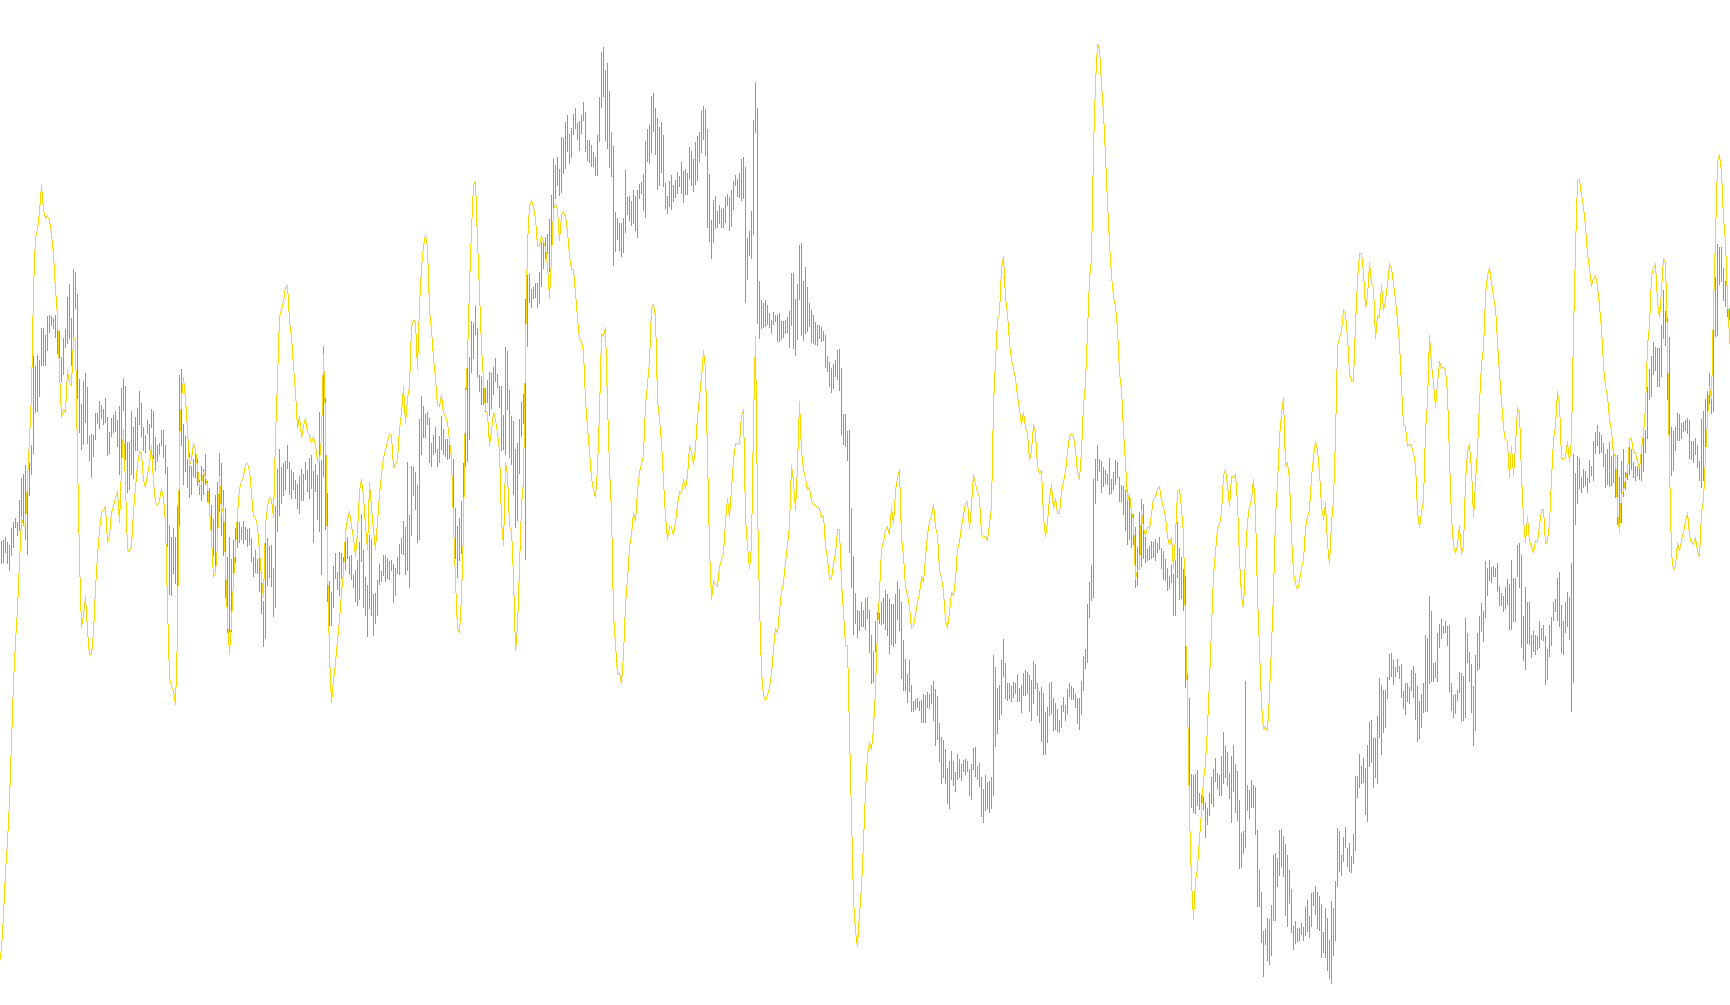
This custom trading indicator is designed to provide visual market analysis by combining three distinct momentum and trend-following calculations into a single view. It helps traders identify the strength, direction, and velocity of price movements by calculating the relationship between different types of moving averages.
Core Components and Logic
The tool operates by processing price data through three primary layers:
1. Momentum Gap Analysis (MACD) The core of the indicator tracks the "distance" between two different types of exponential moving averages—a fast-moving average and a slower-moving average. By calculating the difference between these two, the script identifies whether short-term price momentum is pulling away from or converging toward the long-term trend. This is represented as a primary line that fluctuates based on market speed.
2. Signal Smoothing To help filter out "noise" and prevent traders from reacting to minor, insignificant price flickers, the script applies a secondary smoothing calculation to the momentum gap described above. This creates a "Signal Line." When the primary momentum line crosses this signal line, it serves as a potential cue for a change in trend direction.
3. Combined Oscillator (OsMA) The indicator also incorporates an OsMA (On Balance Volume Moving Average) logic. This layer takes the relationship between the fast and slow averages and subjects it to a specific smoothing process based on volume-weighted principles. This provides a third visual reference point, helping to confirm the reliability of the trends identified by the first two components.
How It Appears on Your Chart
Rather than overlaying directly on the price candles (like a standard moving average), this script operates in a separate window below your main chart. It renders three distinct lines using different colors:
- The Primary Momentum Line: Tracks the raw difference between short and long-term trends.
- The Signal Line: A smoother version of the momentum line used to identify entry/exit points.
- The Combined Oscillator: A secondary confirmation line that validates the strength of the movement.
Summary for the Trader
By looking at these three lines together, you can see not just where the price is going, but how fast it is moving and whether the current trend has enough "weight" to continue. When all three lines move in harmony, it typically indicates a strong, well-supported trend; when they diverge or cross one another, it suggests a potential shift in market sentiment.
//+------------------------------------------------------------------+
//| Custom MACD+OsMA.mq4 |
//| Copyright © 2004, MetaQuotes Software Corp. |
//| http://www.metaquotes.net/ |
//+------------------------------------------------------------------+
#property copyright "Copyright © 2004, MetaQuotes Software Corp."
#property link "http://www.metaquotes.net/"
//---- indicator settings
#property indicator_separate_window
#property indicator_buffers 3
#property indicator_color1 Aqua
#property indicator_color2 Magenta
#property indicator_color3 Yellow
//---- indicator parameters
extern int FastEMA=5;
extern int SlowEMA=13;
extern int SignalSMA=1;
//---- indicator buffers
double ind_buffer1[];
double ind_buffer2[];
double ind_buffer3[];
//+------------------------------------------------------------------+
//| Custom indicator initialization function |
//+------------------------------------------------------------------+
int init()
{
//---- drawing settings
SetIndexStyle(0,DRAW_LINE,STYLE_SOLID,0);
SetIndexStyle(1,DRAW_LINE,STYLE_SOLID,2);
SetIndexStyle(2,DRAW_LINE,STYLE_SOLID,4);
SetIndexDrawBegin(1,SignalSMA);
IndicatorDigits(MarketInfo(Symbol(),MODE_DIGITS)+1);
//---- indicator buffers mapping
if(!SetIndexBuffer(0,ind_buffer1) && !SetIndexBuffer(1,ind_buffer2) && !SetIndexBuffer(2,ind_buffer3))
Print("cannot set indicator buffers!");
//---- name for DataWindow and indicator subwindow label
IndicatorShortName("");
//SetIndexLabel(0,"");
//SetIndexLabel(1,"");
//SetIndexLabel(2,"");
//---- initialization done
return(0);
}
//+------------------------------------------------------------------+
//| Moving Averages Convergence/Divergence |
//+------------------------------------------------------------------+
int start()
{
int limit;
int counted_bars=IndicatorCounted();
//---- check for possible errors
if(counted_bars<0) return(-1);
//---- last counted bar will be recounted
if(counted_bars>0) counted_bars--;
limit=Bars-counted_bars;
//---- macd counted in the 1-st buffer
for(int i=0; i<limit; i++)
ind_buffer1[i]=iMA(NULL,0,FastEMA,0,MODE_EMA,PRICE_CLOSE,i)-iMA(NULL,0,SlowEMA,0,MODE_EMA,PRICE_CLOSE,i);
//---- signal line counted in the 2-nd buffer
for(i=0; i<limit; i++)
ind_buffer2[i]=iMAOnArray(ind_buffer1,Bars,SignalSMA,0,MODE_SMA,i);
for(i=0; i<limit; i++)
ind_buffer3[i]=iOsMA(NULL,0,FastEMA,SlowEMA,SignalSMA,PRICE_CLOSE,i);
//---- done
return(0);
}
Comments