Macd_Correct
Download script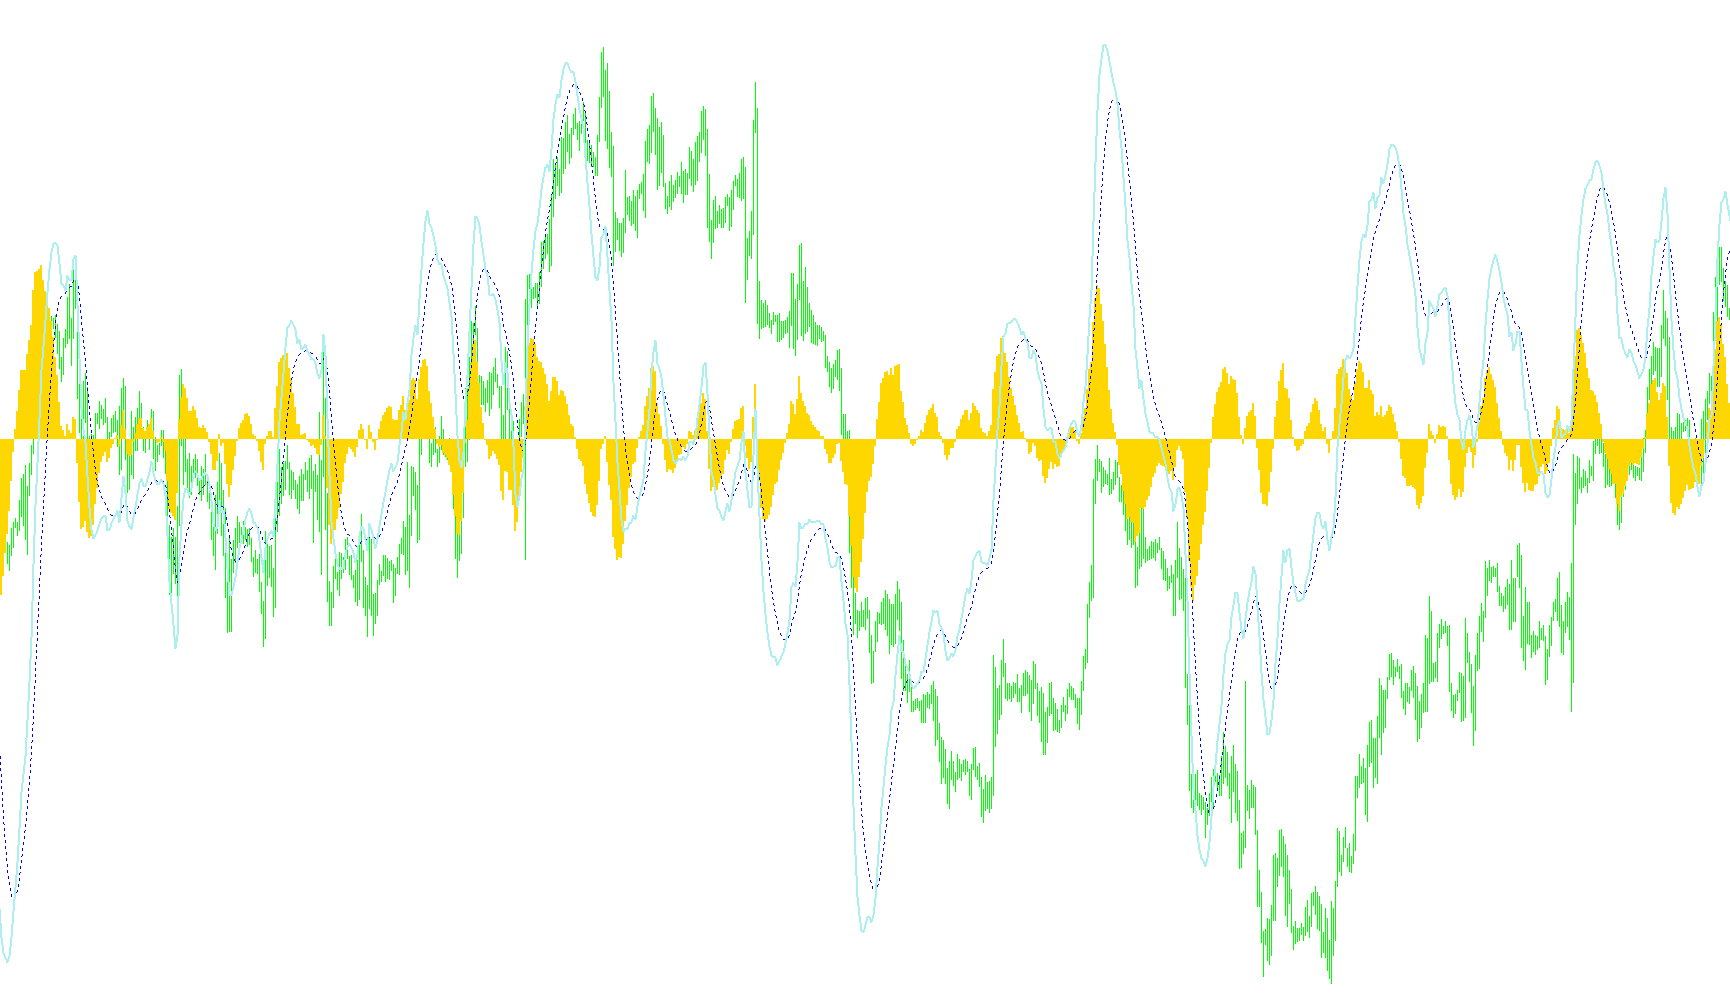
This script is a specialized technical analysis tool designed to provide a precise visual representation of the Moving Average Convergence Divergence (MACD) indicator on trading charts. While the standard MACD is a common market tool, this specific version focuses on mathematical accuracy and customizability to help traders identify momentum shifts and trend reversals more clearly.
Core Logic and Functionality
The script operates by calculating three distinct visual elements simultaneously to give a complete picture of price momentum:
1. The MACD Line At its foundation, the script calculates two different types of moving averages: a "Fast" average (which reacts quickly to recent price changes) and a "Slow" average (which tracks the broader, long-term trend). By subtracting the Slow average from the Fast average, the script produces the MACD Line. This represents the distance between short-term and long-term price movements.
2. The Signal Line The script then takes that MACD Line and applies a secondary smoothing process to it. This creates what is known as the Signal Line. Think of this as a "trend of the trend." By smoothing out the fluctuations of the MACD Line, it helps traders filter out minor market "noise" to see the underlying direction of the momentum more clearly.
3. The Histogram Finally, the script calculates the difference between the MACD Line and the Signal Line to generate the Histogram. This is the visual representation of the gap between the current momentum and its smoothed average. When the histogram bars grow larger, it indicates accelerating momentum; when they shrink or cross the zero midline, it often signals a potential change in trend direction.
Key Features for the User
- High Customization: The script allows you to define exactly how "fast" or "slow" the averages should be. You can also choose the specific mathematical method used to calculate these averages (such as Simple, Exponential, Smoothed, or Linear Weighted) and which price point (Open, High, Low, Close, etc.) the calculation should base itself on.
- Visual Clarity: The script is designed to display these three elements in a dedicated window separate from the main price chart. It uses specific colors and line thicknesses for each component so that the relationship between the actual MACD value, the Signal, and the Histogram is easy to read at a glance.
- Performance Optimization: The logic is programmed to efficiently calculate data across a large number of historical bars (up to 1,000 by default), ensuring that the chart remains responsive while providing enough historical context for thorough analysis.
//+------------------------------------------------------------------+
//|                                                 Macd_Correct.mq4 |
//|                                Copyright © 2005, David W. Thomas |
//|                                           mailto:davidwt@usa.net |
//+------------------------------------------------------------------+

// This is the correct computation and display of MACD.

#property copyright "Copyright © 2005, David W. Thomas"
#property link      "mailto:davidwt@usa.net"

#property indicator_separate_window
#property indicator_buffers 3
#property indicator_color1 Blue
#property indicator_color2 Red
#property indicator_color3 Green

//---- input parameters

extern int IndexMultiplier     = 0;
extern string separator0 = "-------------------------";
extern int Fast_MAPeriod       =  12;
extern int Fast_MA_Shift       =  0;
extern int Fast_MA_Method      =  1; // 0: sma // 1: ema // 2: smma // 3: lwma
extern int Fast_Applied_Price  =  0; // 0: Close // 1: Open // 2: High // 3: Low // 4: Median (H+L/2) // 5: Typical (H+L+C/3) // 6: Weighted (H+L+C+C/4)
extern string separator1 = "-------------------------";
extern int Slow_MAPeriod       =  26;
extern int Slow_MA_Shift       =  0;
extern int Slow_MA_Method      =  1; // 0: sma // 1: ema // 2: smma // 3: lwma
extern int Slow_Applied_Price  =  0; // 0: Close // 1: Open // 2: High // 3: Low // 4: Median (H+L/2) // 5: Typical (H+L+C/3) // 6: Weighted (H+L+C+C/4)
extern string separator2 = "-------------------------";
extern int SignalPeriod        =  9;
extern string separator3 = "-------------------------";
extern int MacdWidth           =  2;
extern int SignalWidth         =  1;
extern int HistogramWidth      =  3;
extern int ShowBars            =  1000;

//---- buffers

double MACDLineBuffer[];
double SignalLineBuffer[];
double HistogramBuffer[];

//---- variables

double alpha = 0;
double alpha_1 = 0;

//+------------------------------------------------------------------+
//| Custom indicator initialization function                         |
//+------------------------------------------------------------------+

int init()
{

   IndicatorDigits(MarketInfo(Symbol(),MODE_DIGITS)+1);

   //---- indicators

   SetIndexEmptyValue(0,0.0);
   SetIndexStyle(0,DRAW_HISTOGRAM,STYLE_SOLID,HistogramWidth);
   SetIndexBuffer(0,HistogramBuffer);
   SetIndexDrawBegin(0,Slow_MAPeriod+SignalPeriod);
   SetIndexLabel(0,"Histogram");

   SetIndexEmptyValue(1,0.0);
   SetIndexStyle(1,DRAW_LINE,STYLE_DOT,SignalWidth);
   SetIndexBuffer(1,SignalLineBuffer);
   SetIndexDrawBegin(1,Slow_MAPeriod+SignalPeriod);
   SetIndexLabel(1,"Signal");

   SetIndexEmptyValue(2,0.0);
   SetIndexStyle(2,DRAW_LINE,STYLE_SOLID,MacdWidth);
   SetIndexBuffer(2,MACDLineBuffer);
   SetIndexDrawBegin(2,Slow_MAPeriod);
   SetIndexLabel(2,"MACD");

   //---- name for DataWindow and indicator subwindow label

   IndicatorShortName("Macd_Correct("+Fast_MAPeriod+","+Slow_MAPeriod+","+SignalPeriod+")");

   //----

	alpha = 2.0 / (SignalPeriod + 1.0);
	alpha_1 = 1.0 - alpha;

   //----

   return(0);
}

//+------------------------------------------------------------------+
//| Custor indicator deinitialization function                       |
//+------------------------------------------------------------------+

int deinit()
{
   //----

   //----
   return(0);
}

//+------------------------------------------------------------------+
//| Custom indicator iteration function                              |
//+------------------------------------------------------------------+

int start()
{

   if (IndexMultiplier == 0) IndexMultiplier = 1;

   int limit;
   int counted_bars = IndicatorCounted();

   //---- check for possible errors

   if (counted_bars<0) return(-1);

   //---- last counted bar will be recounted

   if (counted_bars>0) counted_bars--;

   limit = ShowBars;
   if (limit > Bars) limit = Bars - counted_bars;

   for(int i=limit; i>=0; i--)
   {

      MACDLineBuffer[i]   = (iMA(Symbol(),0,Fast_MAPeriod,Fast_MA_Shift,Fast_MA_Method,Fast_Applied_Price,i)
                          - iMA(Symbol(),0,Slow_MAPeriod,Slow_MA_Shift,Slow_MA_Method,Slow_Applied_Price,i))*IndexMultiplier;

      SignalLineBuffer[i] = alpha*MACDLineBuffer[i] + alpha_1*SignalLineBuffer[i+1];

      HistogramBuffer[i]  = MACDLineBuffer[i] - SignalLineBuffer[i];

   }

   //----

   return(0);
}
//+------------------------------------------------------------------+
Comments