MACD_ColorHist_AlertEMA
Download script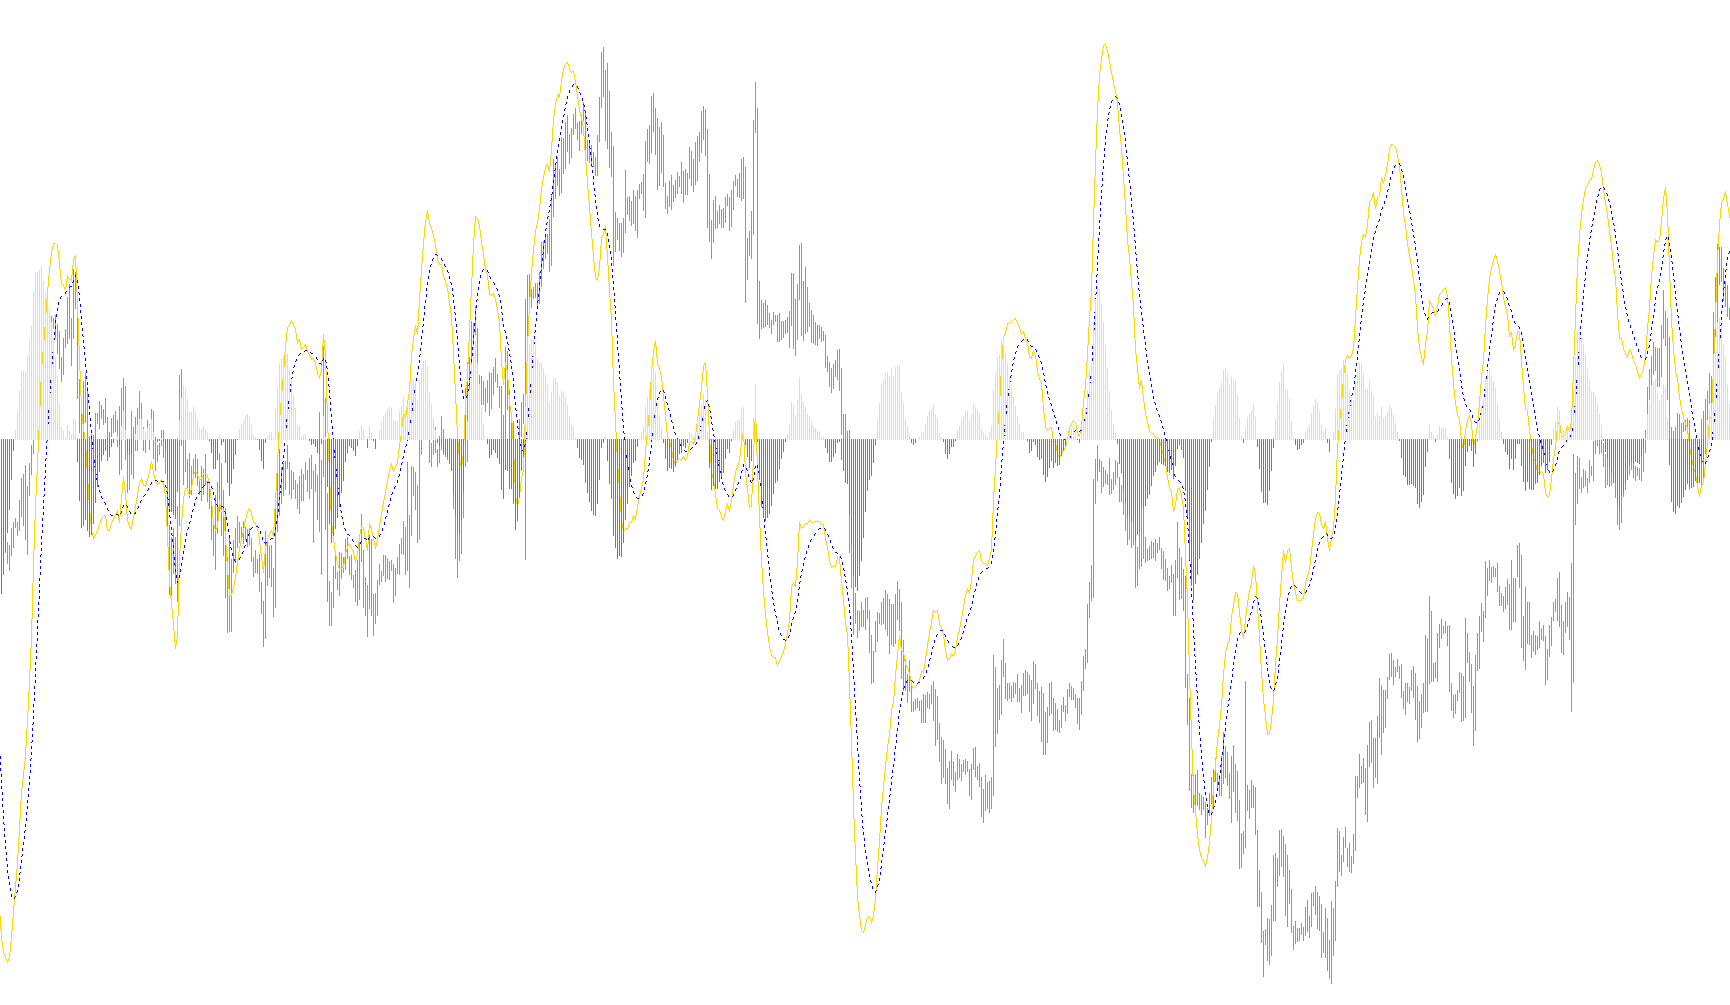
This tool is a specialized technical analysis indicator designed for the MetaTrader platform to help traders visualize market momentum and receive real-time notifications based on price movement trends. It utilizes the Moving Average Convergence Divergence (MACD) methodology, which compares two different speeds of moving averages to identify whether a market is accelerating or decelerating.
Visual Components
The script provides three distinct visual elements on your trading chart:
- The MACD Line: This represents the raw difference between a "fast" and a "slow" moving average. It shows the immediate strength of the price trend.
- The Signal Line: This is a smoothed version of the MACD line itself. It acts as a secondary guide to filter out minor market "noise."
- The Color Histogram: This is the most prominent visual feature. The script calculates the gap between the MACD Line and the Signal Line.
- When the MACD line is above the Signal line, the histogram appears in one color (representing upward momentum).
- When the MACD line drops below the Signal line, the histogram switches to a different color (representing downward momentum).
Automated Logic and Alerts
Beyond just providing a visual chart, this script contains active logic to monitor "crosses"—the specific moments when the MACD Line intersects with the Signal Line. These intersections are often viewed by traders as potential entry or exit points.
The script performs the following automated actions:
- Trend Detection: It constantly monitors the relationship between the two lines. If the MACD line crosses from below to above the Signal line (a "Cross Up"), the script identifies a shift toward positive momentum. Conversely, if it drops from above to below (a "Cross Down"), it identifies a shift toward negative momentum.
- Real-Time Notifications: To ensure you don't have to watch the screen constantly, the script can be configured to notify you instantly when these crosses occur.
- Audio Alerts: A sound notification can trigger on your computer.
- Email Alerts: The script can automatically send an email containing the specific time, date, currency pair, and timeframe of the trend change.
- Redundancy Protection: The logic includes a "flag" system. This ensures that you only receive one notification per cross, preventing the software from sending multiple repetitive alerts for the same single movement.
Summary of Use
Essentially, this tool simplifies complex momentum data into a clear, color-coded visual map. It highlights where the market strength is shifting and proactively alerts the user the moment a significant trend change is detected, allowing for faster decision-making.
//+------------------------------------------------------------------+
//|                                         MACD_ColorHist_Alert.mq4 |
//|                                    Copyright © 2006, Robert Hill |
//|                                                                  |
//+------------------------------------------------------------------+
#property  copyright "Copyright © 2006, Robert Hill"
//---- indicator settings
#property  indicator_separate_window
#property  indicator_buffers 4
#property  indicator_color1  Aqua
#property  indicator_color2  Red
#property  indicator_color3  Green
#property  indicator_color4  Red

//---- indicator parameters

extern bool SoundON=true;
extern bool EmailON=false;

extern int FastEMA=12;
extern int SlowEMA=26;
extern int SignalSMA=9;
//---- indicator buffers
double     ind_buffer1[];
double     ind_buffer2[];
double HistogramBufferUp[];
double HistogramBufferDown[];
int flagval1 = 0;
int flagval2 = 0;
//---- variables

//+------------------------------------------------------------------+
//| Custom indicator initialization function                         |
//+------------------------------------------------------------------+
int init()
  {
//---- drawing settings
//   IndicatorBuffers(3);
   IndicatorDigits(MarketInfo(Symbol(),MODE_DIGITS)+1);
   SetIndexStyle(0,DRAW_LINE,STYLE_SOLID);
   SetIndexBuffer(0,ind_buffer1);
   SetIndexDrawBegin(0,SlowEMA);
   SetIndexStyle(1,DRAW_LINE,STYLE_DOT);
   SetIndexBuffer(1,ind_buffer2);
   SetIndexDrawBegin(1,SignalSMA);
   SetIndexStyle(2,DRAW_HISTOGRAM,STYLE_SOLID);
   SetIndexBuffer(2,HistogramBufferUp);
   SetIndexStyle(3,DRAW_HISTOGRAM,STYLE_SOLID);
   SetIndexBuffer(3,HistogramBufferDown);
//   SetIndexDrawBegin(2,SlowEMA + SignalSMA);
//---- name for DataWindow and indicator subwindow label
   IndicatorShortName("MACD("+FastEMA+","+SlowEMA+","+SignalSMA+")");
   SetIndexLabel(0,"MACD");
   SetIndexLabel(1,"Signal");
   SetIndexLabel(2,"Histogram");

//---- initialization done
   return(0);
  }
//+------------------------------------------------------------------+
//| Moving Averages Convergence/Divergence                           |
//+------------------------------------------------------------------+
int start()
  {
   int limit;
   double temp;

   int counted_bars=IndicatorCounted();
//---- check for possible errors
   if(counted_bars<0) return(-1);
//---- last counted bar will be recounted
   if(counted_bars>0) counted_bars--;
   limit=Bars-counted_bars;
//---- macd counted in the 1-st buffer
   for(int i=0; i<limit; i++)
      ind_buffer1[i]=iMA(NULL,0,FastEMA,0,MODE_EMA,PRICE_CLOSE,i)-iMA(NULL,0,SlowEMA,0,MODE_EMA,PRICE_CLOSE,i);
//---- signal line counted in the 2-nd buffer
   for(i=0; i<limit; i++)
      ind_buffer2[i]=iMAOnArray(ind_buffer1,Bars,SignalSMA,0,MODE_EMA,i);
//      ind_buffer2[i] = alpha*ind_buffer1[i] + alpha_1*ind_buffer2[i+1];

   for(i=0; i<limit; i++)
   {
      HistogramBufferUp[i] = 0;
      HistogramBufferDown[i] = 0;
      temp = ind_buffer1[i] - ind_buffer2[i];
      if (temp >= 0)
        HistogramBufferUp[i] = temp;
      else
        HistogramBufferDown[i] = temp;

      if (i == 1)
      {
        if (HistogramBufferUp[i] > 0 && HistogramBufferDown[i + 1] < 0)
//        if (HistogramBufferUp[i] >  HistogramBufferUp[i + 1])
        {
// Cross up
         if (flagval1==0)
         {
           flagval1=1;
           flagval2=0;
           if (SoundON) Alert("MACD Crossed up","\n Time=",TimeToStr(CurTime(),TIME_DATE)," ",TimeHour(CurTime()),":",TimeMinute(CurTime()),"\n Symbol=",Symbol()," Period=",Period());
           if (EmailON) SendMail("MACD Crossed up", "MACD Crossed up, Date="+TimeToStr(CurTime(),TIME_DATE)+" "+TimeHour(CurTime())+":"+TimeMinute(CurTime())+" Symbol="+Symbol()+" Period="+Period());
         }
        }
        else if (HistogramBufferDown[i] < 0 && HistogramBufferUp[i + 1] > 0)
//        else if (HistogramBufferUp[i] <  HistogramBufferUp[i + 1] )
        {
// Cross down
         if (flagval2==0)
         {
          flagval2=1;
          flagval1=0;
          if (SoundON) Alert("MACD Crossed down","\n Date=",TimeToStr(CurTime(),TIME_DATE)," ",TimeHour(CurTime()),":",TimeMinute(CurTime()),"\n Symbol=",Symbol()," Period=",Period());
          if (EmailON) SendMail("MACD Crossed down","MACD Crossed Down, Date="+TimeToStr(CurTime(),TIME_DATE)+" "+TimeHour(CurTime())+":"+TimeMinute(CurTime())+" Symbol="+Symbol()+" Period="+Period());
         }
        }
      }

   }

//---- done
   return(0);
  }
Comments