Juicenew
Download script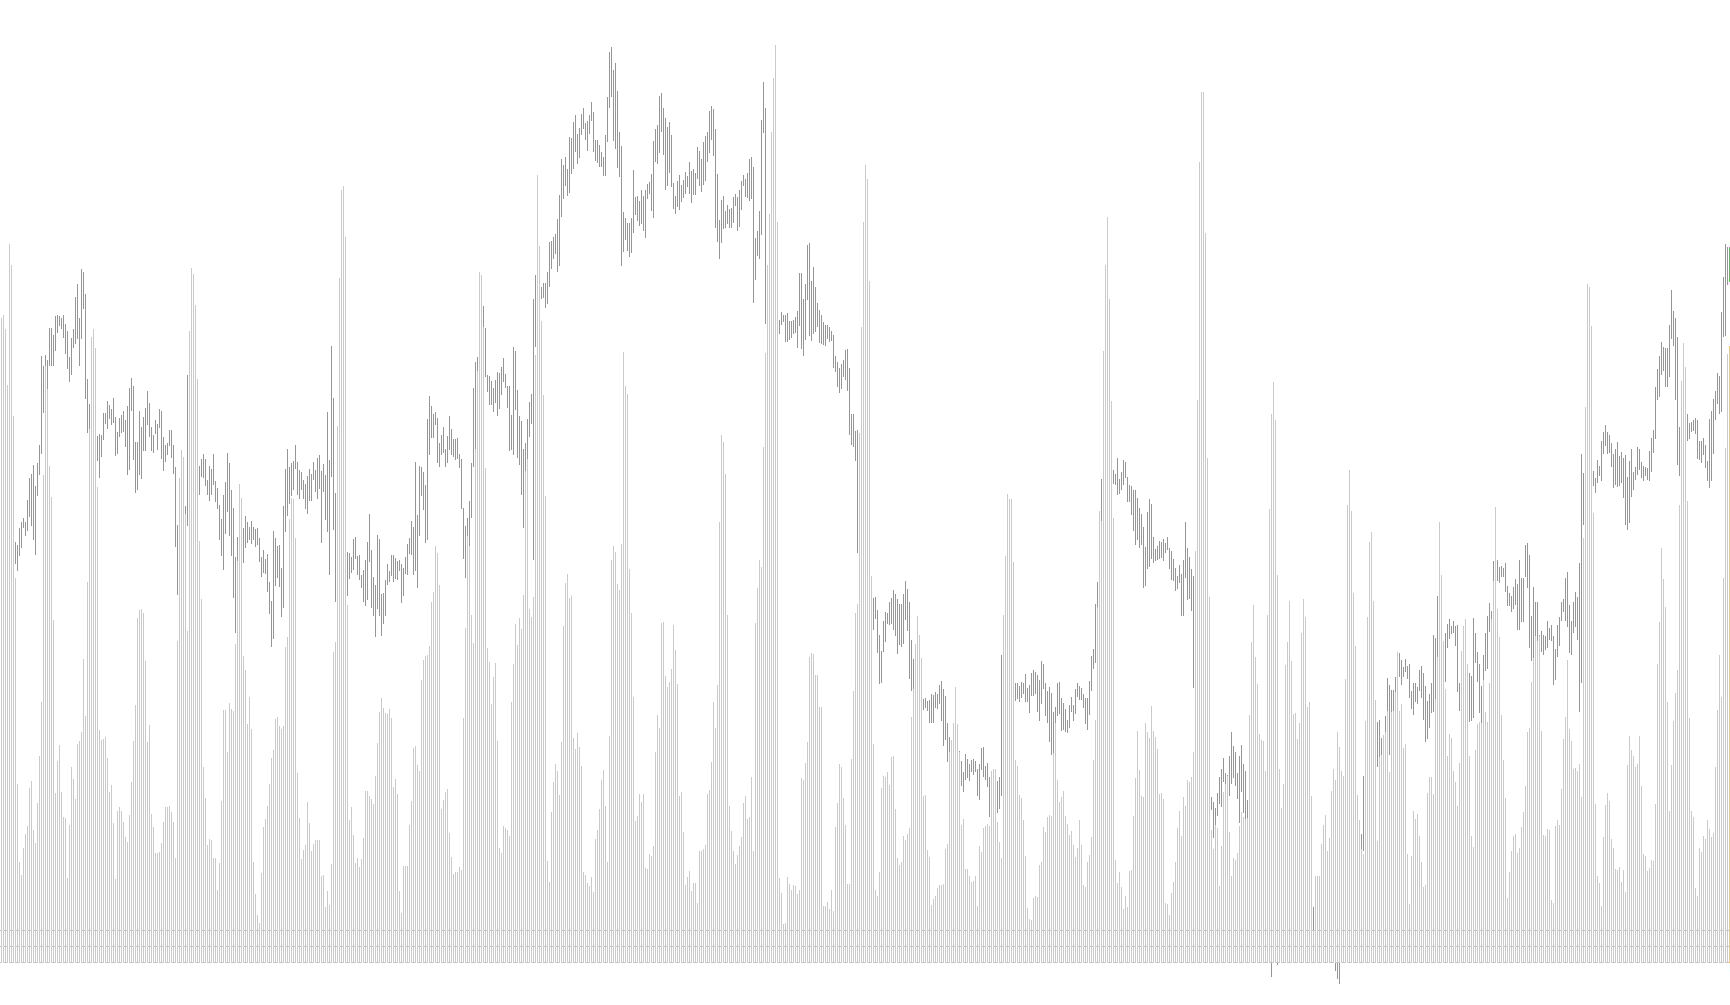
The "Juice" indicator is a visual trading tool designed to help market participants gauge the intensity of price volatility by analyzing the standard deviation of a currency pair or asset. Instead of looking at the price alone, this script measures how much the price fluctuates over a specific timeframe to determine the "quality" of the current market movement.
How the Logic Works
The core functionality of the indicator relies on calculating the Standard Deviation—a mathematical measure of how much prices vary from their average. The script takes these variations and categorizes them into three distinct visual levels, displayed as a histogram:
- High Intensity (Good Juice): When the market volatility exceeds a high pre-defined threshold, the indicator identifies this as significant momentum. This suggests that price movements are large and active.
- Low Intensity (Bad Juice): When the volatility falls below a specific low floor, the indicator flags the market as relatively quiet or stagnant. This indicates a lack of significant movement or "weak" price action.
- Moderate Intensity (So-So Juice): If the volatility stays between the low and high thresholds, it is categorized as moderate activity—neither exceptionally active nor completely flat.
Visual Representation
The indicator provides three distinct bars in a separate window below your main chart:
- Lime Green: Represents "Good Juice" (High Volatility).
- Red: Represents "Bad Juice" (Low Volatility).
- Orange: Represents "So-So Juice" (Moderate Volatility).
Key Objectives for the User
By using this logic, a trader can quickly scan the chart to see the "mood" of the market at a glance. Rather than squinting at raw price candles, you can use the color-coded histogram to identify periods of high-energy movement versus periods of consolidation or low activity. The script allows you to customize the sensitivity by adjusting the period (how much history to look at) and the specific levels that define what constitutes "good," "bad," or "so-so" volatility for your preferred trading style.
/*-----------------------------+
|			       |
| Shared by www.Aptrafx.com    |
|			       |
+------------------------------*/

//+------------------------------------------------------------------+
//|                                                        Juice.mq4 |
//|                                                          Perky_z |
//|                              http://fxovereasy.atspace.com/index |
//+------------------------------------------------------------------+
#property  copyright "perky"
#property  link      "http://fxovereasy.atspace.com/index"

//---- indicator settings
#property  indicator_separate_window
#property  indicator_buffers 3
#property  indicator_color1  LimeGreen
#property  indicator_color2  Red
#property  indicator_color3  Orange
#property  indicator_width1 2
#property  indicator_width2 2
#property  indicator_width3 2
#property  indicator_level1 0.0
#property  indicator_level2 8.0
#property  indicator_level3 11.0
#property  indicator_level4 4.0

//---- indicator parameters
extern int period=7;
extern int thresholdLevel=8;
extern int soSoLevel=4;

double thresholdLevelPoint;
double soSoLevelPoint;

//---- indicator buffers
double GoodJuice[];
double BadJuice[];
double SoSoJuice[];


//+------------------------------------------------------------------+
//| Custom indicator initialization function                         |
//+------------------------------------------------------------------+
int init()
{
   SetIndexStyle(0,DRAW_HISTOGRAM,STYLE_SOLID);
   SetIndexStyle(1,DRAW_HISTOGRAM,STYLE_SOLID);
   SetIndexStyle(2,DRAW_HISTOGRAM,STYLE_SOLID);

   SetIndexDrawBegin(0,period);
   SetIndexDrawBegin(1,period);
   SetIndexDrawBegin(2,period);

   IndicatorDigits(MarketInfo(Symbol(),MODE_DIGITS)+2);

   SetIndexBuffer(0,GoodJuice);
   SetIndexBuffer(1,BadJuice);
   SetIndexBuffer(2,SoSoJuice);

   IndicatorDigits(2);

   thresholdLevelPoint = thresholdLevel * Point;
   soSoLevelPoint = soSoLevel * Point;

   SetLevelValue(0, 0.0);
   SetLevelValue(1, soSoLevel);
   SetLevelValue(2, thresholdLevel);

   IndicatorShortName("Juice("+period+","+DoubleToStr(thresholdLevelPoint,Digits)+")");

   return(0);
}

//+------------------------------------------------------------------+
//| Moving Average of Oscillator                                     |
//+------------------------------------------------------------------+
int start()
{
   int limit,i;
   int counted_bars=IndicatorCounted();
//---- check for possible errors
   if(counted_bars<0) return(-1);
//---- last counted bar will be recounted
   if(counted_bars>0) counted_bars--;
   limit=Bars-counted_bars;

   for(i=limit; i>=0; i--)
   {
      double stddev = iStdDev(NULL,0,period,MODE_EMA,0,PRICE_CLOSE,i);

      if (stddev >= thresholdLevelPoint)
      {
         GoodJuice[i] = stddev / Point;
         BadJuice[i] = 0.0;
         SoSoJuice[i] = 0.0;
      }
      else if (stddev < soSoLevelPoint)
      {
         BadJuice[i] = stddev / Point;
         GoodJuice[i] = 0.0;
         SoSoJuice[i] = 0.0;
      }
      else
      {
         SoSoJuice[i] = stddev / Point;
         GoodJuice[i] = 0.0;
         BadJuice[i] = 0.0;
      }
   }

   return(0);
}
Comments