Juice-modified
Download script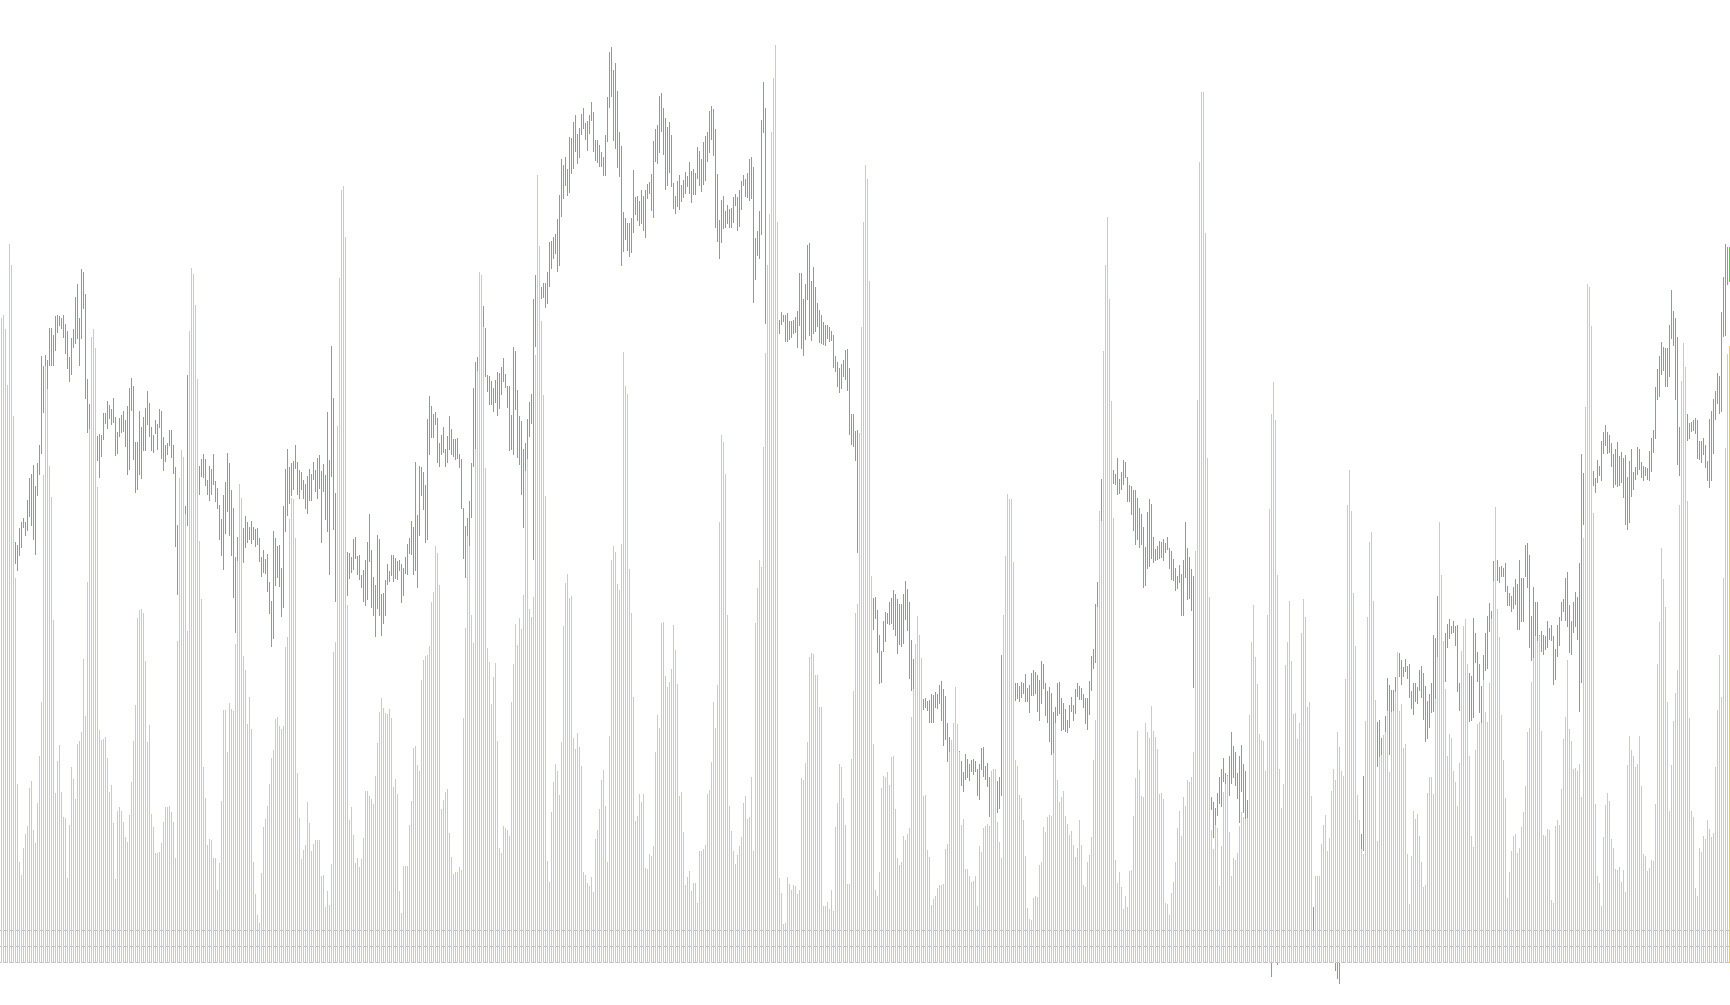
The "Juice" indicator is designed to help traders visualize market volatility and price movement intensity through a distinct, color-coded visual system. Instead of simply showing raw price action, it focuses on identifying the "strength" or "quality" of current market momentum.
How the Logic Works
The tool operates by calculating the Standard Deviation of the market—a mathematical measure used to determine how much prices are fluctuating away from their average over a specific timeframe. Based on these fluctuations, the script categorizes the market movement into three distinct "zones":
- High Intensity (Good Juice): When the market volatility exceeds a high pre-set threshold, the indicator recognizes this as significant activity. These moments are highlighted in Lime Green, signaling strong price action.
- Low Intensity (Bad Juice): When volatility falls below a very low floor, the indicator identifies these as periods of stagnation or weakness. These segments are highlighted in FireBrick, suggesting a lack of significant movement.
- Moderate Activity (So-So Juice): When the market stays between the high and low extremes, it is considered neutral or average activity. This is represented in Orange.
Visual Presentation
The indicator appears in a separate window below your main trading chart as a histogram. By observing these colored bars, you can quickly assess the "health" of the current market trend at a glance:
- Green Bars: Significant momentum is present.
- Red Bars: The market is relatively quiet or lacks direction.
- Orange Bars: The market is moving with moderate, average energy.
By providing this visual summary, the script allows you to see whether the current price action has enough "juice" (momentum) to be considered significant, helping you filter out noisy periods of low activity or identify high-energy shifts in the market.
/*-----------------------------+
|			       |
| Shared by www.Aptrafx.com    |
|			       |
+------------------------------*/

//+------------------------------------------------------------------+
//|                                                        Juice.mq4 |
//|                                                          Perky_z |
//|                              http://fxovereasy.atspace.com/index |
//+------------------------------------------------------------------+
#property  copyright "perky"
#property  link      "http://fxovereasy.atspace.com/index"

//---- indicator settings
#property  indicator_separate_window
#property  indicator_buffers 3
#property  indicator_color1  LimeGreen
#property  indicator_color2  FireBrick
#property  indicator_color3  Orange
#property  indicator_width1 2
#property  indicator_width2 2
#property  indicator_width3 2
#property  indicator_level1 0.0
#property  indicator_level2 8.0
#property  indicator_level3 11.0

//---- indicator parameters
extern int period=7;
extern int thresholdLevel=8;
extern int soSoLevel=4;

double thresholdLevelPoint;
double soSoLevelPoint;

//---- indicator buffers
double GoodJuice[];
double BadJuice[];
double SoSoJuice[];


//+------------------------------------------------------------------+
//| Custom indicator initialization function                         |
//+------------------------------------------------------------------+
int init()
{
   SetIndexStyle(0,DRAW_HISTOGRAM,STYLE_SOLID);
   SetIndexStyle(1,DRAW_HISTOGRAM,STYLE_SOLID);
   SetIndexStyle(2,DRAW_HISTOGRAM,STYLE_SOLID);

   SetIndexDrawBegin(0,period);
   SetIndexDrawBegin(1,period);
   SetIndexDrawBegin(2,period);

   IndicatorDigits(MarketInfo(Symbol(),MODE_DIGITS)+2);

   SetIndexBuffer(0,GoodJuice);
   SetIndexBuffer(1,BadJuice);
   SetIndexBuffer(2,SoSoJuice);

   IndicatorDigits(2);

   thresholdLevelPoint = thresholdLevel * Point;
   soSoLevelPoint = soSoLevel * Point;

   SetLevelValue(0, 0.0);
   SetLevelValue(1, soSoLevel);
   SetLevelValue(2, thresholdLevel);

   IndicatorShortName("Juice("+period+","+DoubleToStr(thresholdLevelPoint,Digits)+")");

   return(0);
}

//+------------------------------------------------------------------+
//| Moving Average of Oscillator                                     |
//+------------------------------------------------------------------+
int start()
{
   int limit,i;
   int counted_bars=IndicatorCounted();
//---- check for possible errors
   if(counted_bars<0) return(-1);
//---- last counted bar will be recounted
   if(counted_bars>0) counted_bars--;
   limit=Bars-counted_bars;

   for(i=limit; i>=0; i--)
   {
      double stddev = iStdDev(NULL,0,period,MODE_EMA,0,PRICE_CLOSE,i);

      if (stddev >= thresholdLevelPoint)
      {
         GoodJuice[i] = stddev / Point;
         BadJuice[i] = 0.0;
         SoSoJuice[i] = 0.0;
      }
      else if (stddev < soSoLevelPoint)
      {
         BadJuice[i] = stddev / Point;
         GoodJuice[i] = 0.0;
         SoSoJuice[i] = 0.0;
      }
      else
      {
         SoSoJuice[i] = stddev / Point;
         GoodJuice[i] = 0.0;
         BadJuice[i] = 0.0;
      }
   }

   return(0);
}
Comments