J_TPO_v3
Download script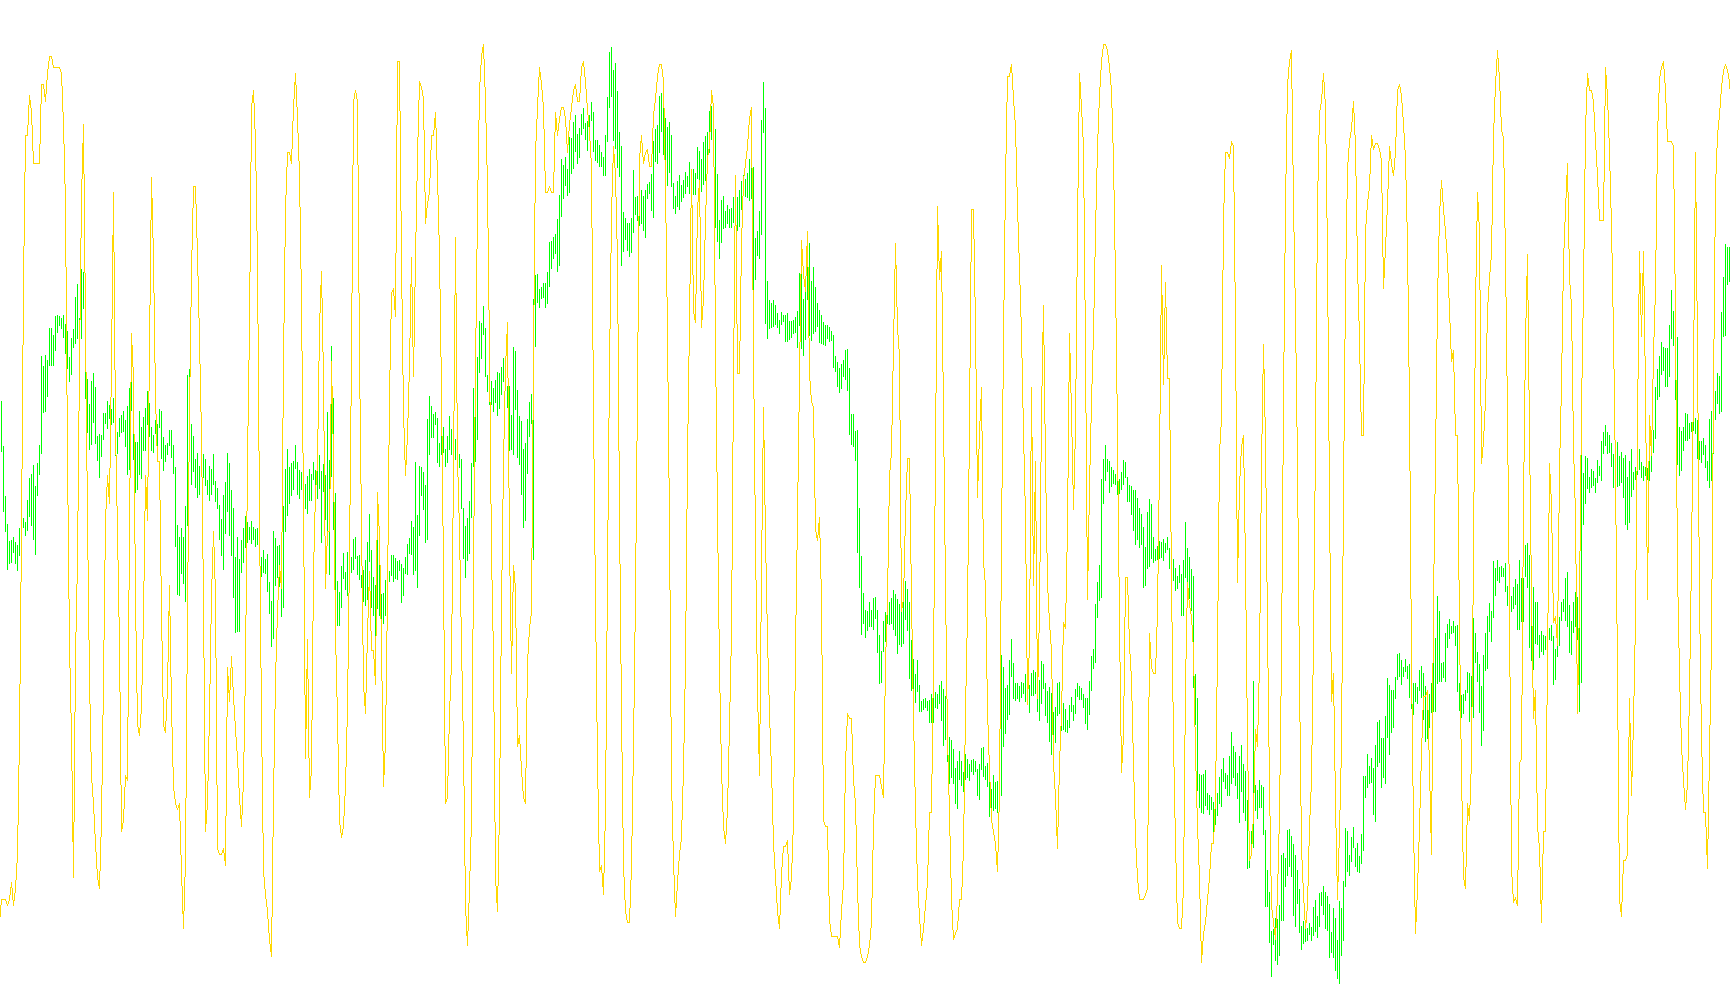
This script is designed to function as a custom technical indicator for the MetaTrader platform, providing a smoothed visualization of price movement based on historical data. Instead of reacting impulsively to every minor price fluctuation, it uses a sophisticated mathematical approach to filter out "noise" and identify more significant trends.
Core Logic Overview
The indicator operates by analyzing a specific window of recent price history (determined by the user-defined length). Rather than simply calculating a standard average, the script performs a multi-step processing sequence:
- Data Collection & Dynamic Sequencing: The tool looks back at previous closing prices and organizes them into a structured internal list. It is designed to intelligently handle these data points as they arrive in real-time, ensuring that the most recent price movements are prioritized.
- Weighted Trend Identification: Once the relevant price data is gathered, the script performs a series of internal calculations to determine the relationship between different price levels. It seeks to identify where the "weight" of the movement lies within the selected period.
- Advanced Smoothing (Signal Processing): To prevent the indicator from being too erratic, it employs a mathematical distribution technique. This involves calculating the variance and distribution of prices relative to a central point. By analyzing how far prices deviate from this center—and weighting them accordingly—the script produces a much smoother and more stable output line than a standard moving average.
- Safety Filtering: To ensure the visual representation remains clean on your chart, the logic includes a safety check that prevents the indicator from dropping to zero in a way that might obscure other data. It maintains a minimal baseline value to ensure the trend line remains visible and continuous.
How it appears on your chart
The result of these calculations is a single, flowing line (rendered in Dodger Blue). This line represents a refined version of price momentum. Because of the complex weighting logic used behind the scenes, the resulting curve is intended to show the underlying direction of the market, helping traders identify trends while ignoring minor, insignificant price "jitters."
/*-----------------------------+
|			       |
| Shared by www.Aptrafx.com    |
|			       |
+------------------------------*/

//+------------------------------------------------------------------+
//|                                                        J_TPO.mq4 |
//|                      Copyright © 2004,                           |
//|                                                                  |
//+------------------------------------------------------------------+
#property copyright "Copyright © 2004, ."
#property link      ""

#property indicator_separate_window
#property indicator_minimum -1
#property indicator_maximum 1
#property indicator_buffers 1
#property indicator_color1 DodgerBlue
//---- input parameters
extern int       Len=10;
//---- buffers
double ExtMapBuffer1[];
//+------------------------------------------------------------------+
//| Custom indicator initialization function                         |
//+------------------------------------------------------------------+
int init()
  {
//---- indicators
   SetIndexStyle(0,DRAW_LINE);
   SetIndexBuffer(0, ExtMapBuffer1);
//----
   return(0);
  }

//+------------------------------------------------------------------+
//| J_TPO indicatop                                                  |
//+------------------------------------------------------------------+
int start()
  {
   //int limit;
   //int counted_bars=IndicatorCounted();
//---- check for possible errors
   //if(counted_bars<0) return(-1);
//---- last counted bar will be recounted
   //if(counted_bars>0) counted_bars--;
   //limit=Bars-counted_bars;
//---- main loop

     double f0, f8, f10, f18, f20, f28, f30, f40, k,
      var14, var18, var1C, var20, var24, shift, value;
     int f38, f48, var6, var12, varA, varE;
     double arr0[300], arr1[300], arr2[300], arr3[300];

   //f38=0;
   for(int i=Bars-Len-100; i>=0; i--)
     {
     var14=0;
     var1C=0;
     if(f38==0)
      {
      f38=1;
      f40=0;
      if (Len-1>= 2) f30=Len-1;
      else f30=2;
      f48=f30+1;
      f10=Close[i];
      arr0[f38] = Close[i];
      k=f48;
      f18 = 12 / (k * (k - 1) * (k + 1));
      f20 = (f48 + 1) * 0.5;
      }
     else
      {
      if (f38 <= f48) f38 = f38 + 1;
      else f38 = f48 + 1;
      f8 = f10;
      f10 = Close[i];
      if (f38 > f48)
        {
        for (var6 = 2; var6<=f48; var6++) arr0[var6-1] = arr0[var6];
        arr0[f48] = Close[i];
        }
      else arr0[f38] = Close[i];
      if ((f30 >= f38) && (f8 != f10)) f40 = 1;
      if ((f30 == f38) && (f40 == 0)) f38 = 0;
     }

   if (f38 >= f48)
      {
      for (varA=1; varA<=f48; varA++)
         {
         arr2[varA] = varA;
         arr3[varA] = varA;
         arr1[varA] = arr0[varA];
         }

      for (varA=1; varA<=(f48-1); varA++)
         {
         var24 = arr1[varA];
         var12 = varA;
         var6 = varA + 1;
         for (var6=varA+1; var6<=f48; var6++)
            {
            if (arr1[var6] < var24)
               {
               var24 = arr1[var6];
               var12 = var6;
               }
            }

         var20 = arr1[varA];
         arr1[varA] = arr1[var12];
         arr1[var12] = var20;
         var20 = arr2[varA];
         arr2[varA] = arr2[var12];
         arr2[var12] = var20;
         }

      varA = 1;
      while (f48 > varA)
        {
        var6 = varA + 1;
        var14 = 1;
        var1C = arr3[varA];
        while (var14 != 0)
          {
          if (arr1[varA] != arr1[var6])
             {
             if ((var6 - varA) > 1)
                {
                var1C = var1C / (var6 - varA);
                varE = varA;
                for (varE=varA; varE<=(var6-1); varE++)
                   arr3[varE] = var1C;

                }
             var14 = 0;
             }
          else
             {
             var1C = var1C + arr3[var6];
             var6 = var6 + 1;
             }
          }
        varA = var6;
        }
      var1C = 0;
      for (varA=1; varA<=f48; varA++)
        var1C = var1C + (arr3[varA] - f20) * (arr2[varA] - f20);

      var18 = f18 * var1C;
     }
   else
     var18 = 0;

   value = var18;
   if (value == 0) value = 0.00001;

   ExtMapBuffer1[i]=value;
   }
//---- done
   return(0);
  }
//+------------------------------------------------------------------+
Comments