Juice5Level
Download script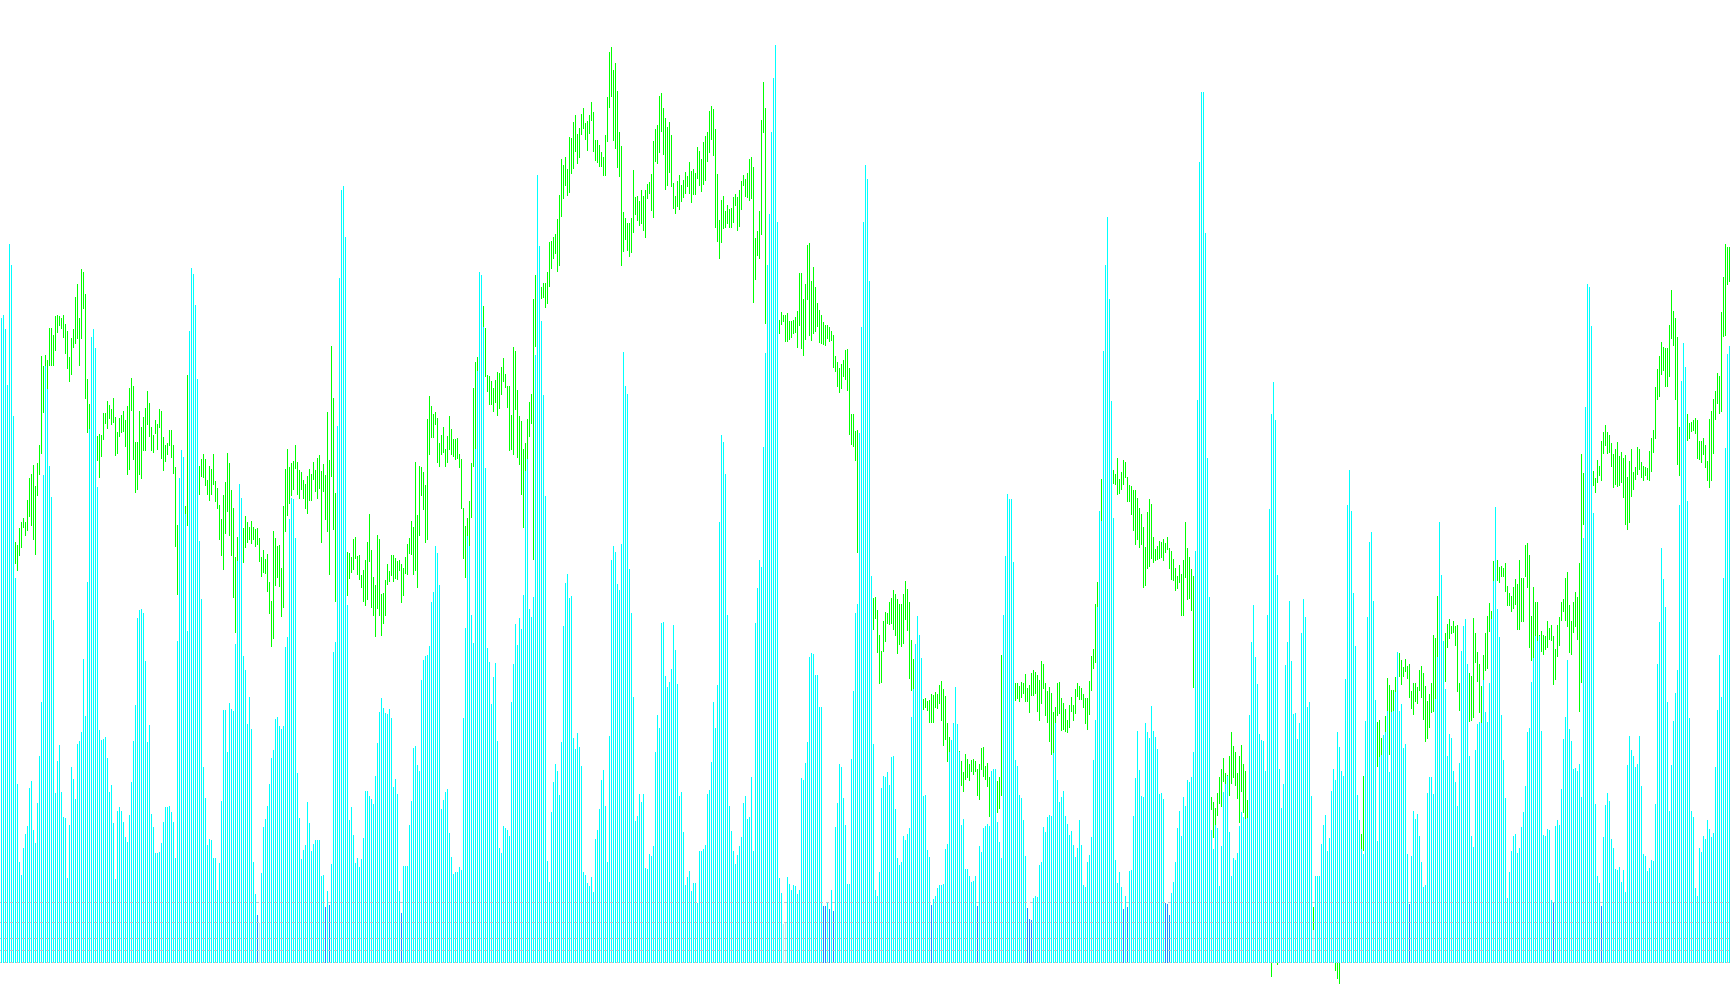
The Juice indicator is a visual market analysis tool designed to measure and categorize the volatility of price movements in real-time. Rather than looking at simple price direction, it focuses on "volatility intensity"—essentially gauging how much the market is moving relative to its recent average.
Core Logic and Functionality
The script operates by calculating the Standard Deviation of the closing prices over a specific number of bars (defined by the user). In financial terms, Standard Deviation measures how far the current price is deviating from its mean. The indicator takes this raw data and converts it into a visual "volatility gauge" displayed in a separate window on your chart.
How it Categorizes Market Activity
To make the data easy to read, the script automatically sorts these volatility measurements into five distinct levels. Each level is represented by a different color on the chart, allowing you to identify the current market "mood" at a glance:
- Low Volatility (Red): Represents periods of very quiet, tight price action.
- Moderate Volatility 1 (Yellow): Indicates a slight increase in activity compared to the baseline.
- Moderate Volatility 2 (Magenta): Signals a steady rise in market movement.
- High Volatility (Orange): Shows significant price swings and active trading.
- Extreme Volatility (Lime Green): Highlights intense, rapid price movements where the market is moving aggressively.
Practical Application
By using this logic, the indicator provides a visual history of market energy. Instead of seeing a chaotic web of numbers, you see a color-coded histogram. This allows traders to quickly identify whether the market is entering a period of stagnation (low activity) or if it is becoming highly turbulent (extreme activity), helping to gauge the underlying strength or exhaustion of current price trends.
/*-----------------------------+
|			       |
| Shared by www.Aptrafx.com    |
|			       |
+------------------------------*/

//+------------------------------------------------------------------+
//|                                                        Juice.mq4 |
//|                                                          Perky_z |
//|                              http://fxovereasy.atspace.com/index |
//|                                   Modified by MrPip and traden4x |
//+------------------------------------------------------------------+
#property  copyright "perky"
#property  link      "http://fxovereasy.atspace.com/index"

//---- indicator settings
#property  indicator_separate_window
#property  indicator_buffers 5
#property  indicator_color1  Red
#property  indicator_color2  Yellow
#property  indicator_color3  Magenta
#property  indicator_color4  Orange
#property  indicator_color5  LimeGreen
#property  indicator_width1 2
#property  indicator_width2 2
#property  indicator_width3 2
#property  indicator_width4 2
#property  indicator_width5 2

//---- indicator parameters
extern int period=7;
extern int LowLevel=3;
extern int MedLevel=6;
extern int HighLevel=10;
extern int ExtremeLevel=15;

double LowLevelPoint;
double MedLevelPoint;
double HighLevelPoint;
double ExtremeLevelPoint;


//---- indicator buffers
double LowJuice[];
double Med1Juice[];
double Med2Juice[];
double HighJuice[];
double ExtremeJuice[];


//+------------------------------------------------------------------+
//| Custom indicator initialization function                         |
//+------------------------------------------------------------------+
int init()
{
   SetIndexStyle(0,DRAW_HISTOGRAM,STYLE_SOLID);
   SetIndexStyle(1,DRAW_HISTOGRAM,STYLE_SOLID);
   SetIndexStyle(2,DRAW_HISTOGRAM,STYLE_SOLID);
   SetIndexStyle(3,DRAW_HISTOGRAM,STYLE_SOLID);
   SetIndexStyle(4,DRAW_HISTOGRAM,STYLE_SOLID);
//   SetIndexStyle(5,DRAW_HISTOGRAM,STYLE_SOLID);

   SetIndexDrawBegin(0,period);
   SetIndexDrawBegin(1,period);
   SetIndexDrawBegin(2,period);
   SetIndexDrawBegin(3,period);
   SetIndexDrawBegin(4,period);
//   SetIndexDrawBegin(5,period);

//   IndicatorDigits(MarketInfo(Symbol(),MODE_DIGITS));

   SetIndexBuffer(0,LowJuice);
   SetIndexBuffer(1,Med1Juice);
   SetIndexBuffer(2,Med2Juice);
   SetIndexBuffer(3,HighJuice);
   SetIndexBuffer(4,ExtremeJuice);
//   SetIndexBuffer(5,SoSoJuice);

   IndicatorDigits(2);

   LowLevelPoint = LowLevel * Point;
   MedLevelPoint = MedLevel * Point;
   HighLevelPoint = HighLevel * Point;
   ExtremeLevelPoint = ExtremeLevel * Point;

   SetLevelValue(0, 0.0);
   SetLevelValue(1, LowLevel);
   SetLevelValue(2, MedLevel);
   SetLevelValue(3, HighLevel);
   SetLevelValue(4, ExtremeLevel);

   return(0);
}

//+------------------------------------------------------------------+
//| Moving Average of Oscillator                                     |
//+------------------------------------------------------------------+
int start()
{
   int limit,i;
   int counted_bars=IndicatorCounted();
//---- check for possible errors
   if(counted_bars<0) return(-1);
//---- last counted bar will be recounted
   if(counted_bars>0) counted_bars--;
   limit=Bars-counted_bars;

   for(i=limit; i>=0; i--)
   {
      double stddev = iStdDev(NULL,0,period,MODE_EMA,0,PRICE_CLOSE,i);
      IndicatorShortName("Juice5Level("+period+") " + DoubleToStr(NormalizeDouble(stddev / Point,2),2) + " ");

      if (stddev <= LowLevelPoint)
      {
         LowJuice[i] = stddev / Point;
         Med1Juice[i] = 0.0;
         Med2Juice[i] = 0.0;
         HighJuice[i] = 0.0;
         ExtremeJuice[i] = 0.0;
      }
      else if ((stddev > LowLevelPoint) && (stddev <= MedLevelPoint))
      {
         Med1Juice[i] = stddev / Point;
         LowJuice[i] = 0.0;
         Med2Juice[i] = 0.0;
         HighJuice[i] = 0.0;
         ExtremeJuice[i] = 0.0;
      }
      else if ((stddev > MedLevelPoint) && (stddev <= HighLevelPoint))
      {
         Med2Juice[i] = stddev / Point;
         LowJuice[i] = 0.0;
         Med1Juice[i] = 0.0;
         HighJuice[i] = 0.0;
         ExtremeJuice[i] = 0.0;
      }
      else if ((stddev > HighLevelPoint) && (stddev <= ExtremeLevelPoint))
      {
         HighJuice[i] = stddev / Point;
         LowJuice[i] = 0.0;
         Med1Juice[i] = 0.0;
         Med2Juice[i] = 0.0;
         ExtremeJuice[i] = 0.0;
      }
      else
      {
         ExtremeJuice[i] = stddev / Point;
         LowJuice[i] = 0.0;
         Med1Juice[i] = 0.0;
         Med2Juice[i] = 0.0;
         HighJuice[i] = 0.0;
      }
   }

   return(0);
}
Comments