JR_Trend_Indicator_001
Download script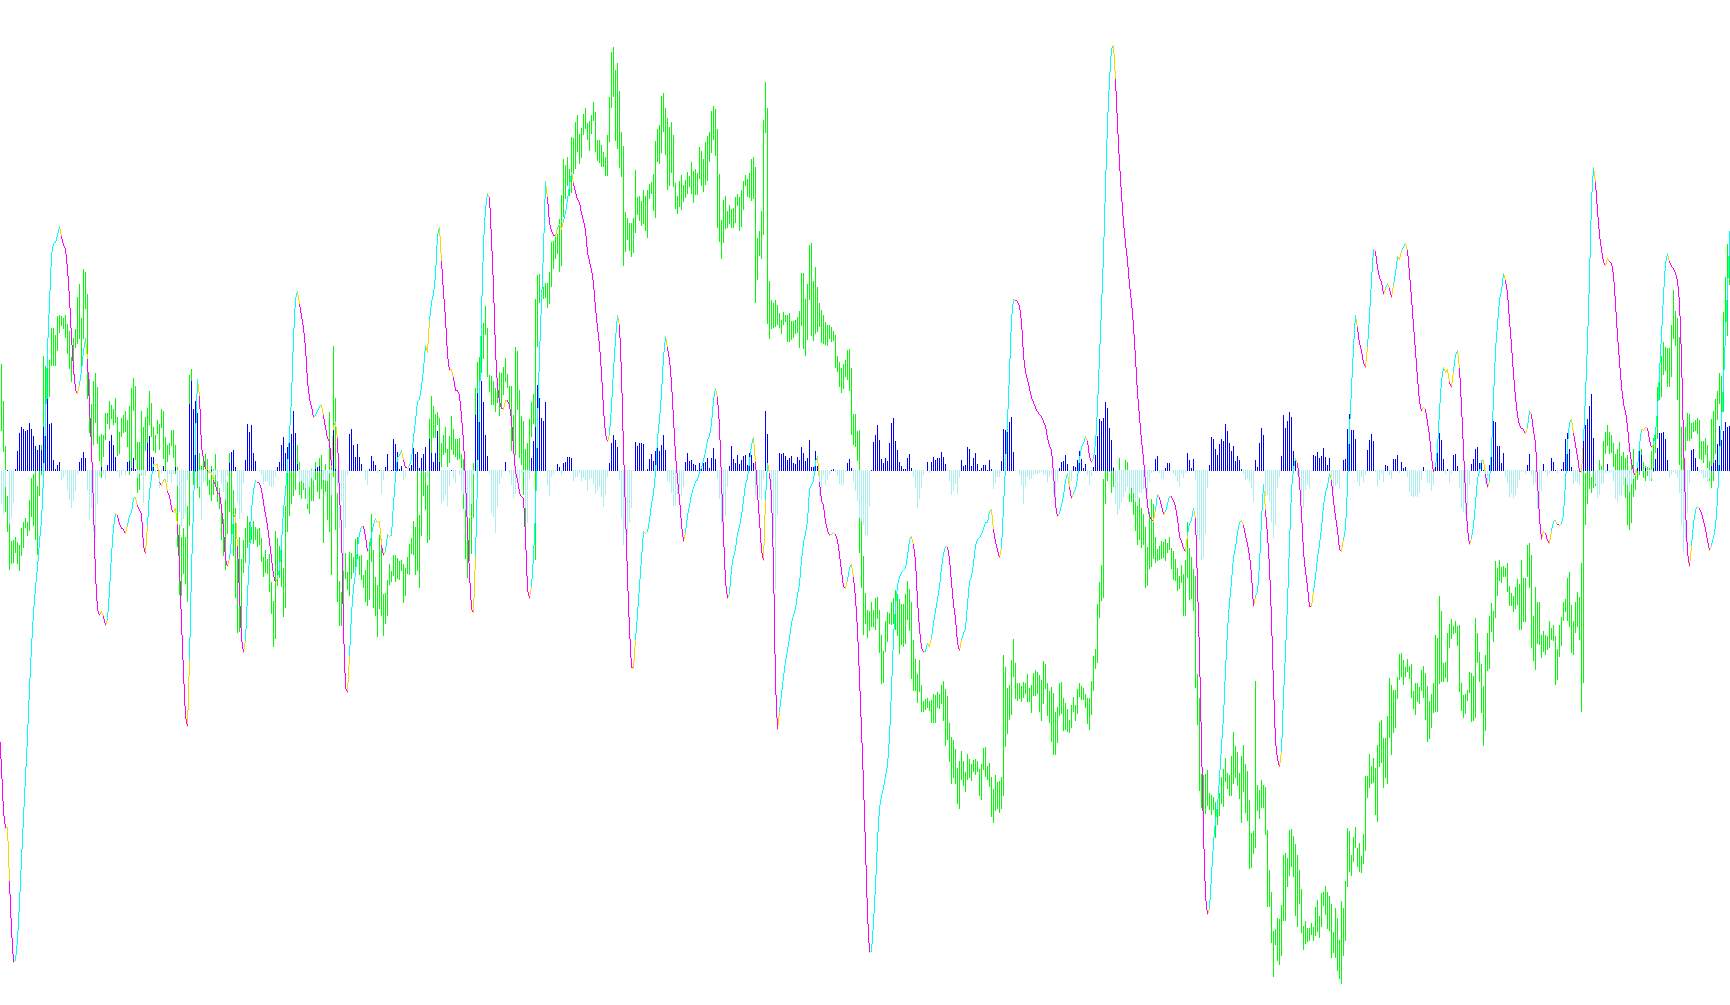
The 4Hour Vegas Model - Weekly Chart Direction Calculator is a technical analysis tool designed to simplify how traders identify the momentum and prevailing direction of a market trend. Instead of requiring you to manually interpret multiple complex moving averages, this script automates the relationship between two specific types of averages to provide a clear visual summary of market behavior.
Core Logic Overview
The script operates by comparing two moving averages: a fast-moving average (SMA5) and a slower-moving average (EMA21). By looking at how the distance between these two lines changes over time, the tool determines if the current trend is gaining strength, losing power, or shifting direction.
How it Works
The logic follows a three-step process to generate its visual data:
1. Trend Difference Calculation The tool first calculates the "gap" between the fast and slow moving averages. This gap represents the current distance of the price from its recent average.
2. Momentum Comparison (Velocity) The script doesn't just look at the current gap; it compares the current gap to the gap from the previous candle.
- If the gap is growing larger in a positive direction, it indicates accelerating upward momentum.
- If the gap is shrinking or widening in a negative direction, it indicates downward momentum.
3. Visual Output The indicator translates these calculations into easy-to-read visual elements on your chart:
- Dynamic Lines & Histograms: It provides a continuous line showing the raw difference between the moving averages and uses histograms to highlight whether that difference is increasing or decreasing compared to the previous period.
- Directional Mapping: The script identifies an "UP" or "DOWN" direction based on these momentum shifts. It then populates specific visual markers (lines and values) to highlight whether the market is currently favoring a bullish (upward) or bearish (downward) trajectory.
Key Features for Traders
- Automated Momentum Tracking: You can see at a glance if the trend is accelerating or decelerating without doing manual math.
- Weekly Context: The script includes logic to track and store the direction for the current week, providing a broader perspective on market movement.
- Simplified Visualization: By distilling complex moving average data into distinct colors and histogram bars, it allows for quicker decision-making during active trading sessions.
//+------------------------------------------------------------------+
//| 4Hour Vegas Model - Weekly Chart Direction Calculator            |
//|                                                           Spiggy |
//|                                                                  |
//+------------------------------------------------------------------+
#property copyright "Jrich3"
#property link      ""

#property indicator_separate_window
//#property indicator_buffers 4
#property indicator_buffers 6
#property indicator_color1 Yellow
#property indicator_color2 DarkGreen
#property indicator_color3 Maroon

//#property indicator_color4 Red
#property indicator_color5 Lime
#property indicator_color6 Red

//---- input parameters

//---- buffers
double ExtMapBuffer1[];
double ExtMapBuffer2[];
double ExtMapBuffer3[];

double ExtMapBuffer4[];
double ExtMapBuffer5[];

//+------------------------------------------------------------------+
//| Custom indicator initialization function                         |
//+------------------------------------------------------------------+
int init()
  {
//---- indicators
   SetIndexStyle(0,DRAW_LINE);
   SetIndexBuffer(0,ExtMapBuffer1);
   SetIndexStyle(1,DRAW_HISTOGRAM);
   SetIndexBuffer(1,ExtMapBuffer2);
   SetIndexStyle(2,DRAW_HISTOGRAM);
   SetIndexBuffer(2,ExtMapBuffer3);


   SetIndexStyle(4,DRAW_LINE);
   //SetIndexStyle(4,DRAW_ARROW,STYLE_SOLID,1);
   SetIndexBuffer(4,ExtMapBuffer4);
   SetIndexArrow(4,159);

   SetIndexStyle(5,DRAW_LINE);
   //SetIndexStyle(5,DRAW_ARROW,STYLE_SOLID,1);
   SetIndexBuffer(5,ExtMapBuffer5);
   SetIndexArrow(5,159);

//----
   return(0);
  }
//+------------------------------------------------------------------+
//| Custor indicator deinitialization function                       |
//+------------------------------------------------------------------+
int deinit()
  {
//----

//----
   return(0);
  }
//+------------------------------------------------------------------+
//| Custom indicator iteration function                              |
//+------------------------------------------------------------------+
int start()
{
  int    limit;
  int    i;
  int    counted_bars=IndicatorCounted();
  double EMA21;
  double SMA5;
  double EMA21Prev;
  double SMA5Prev;
  string ValueIndex;
  string Direction;
  string KeyValue;

  // Always prepare all of the information for the other indicators
  if(counted_bars<0) return(-1);

  if(counted_bars>0) counted_bars--;
  limit=Bars-counted_bars;

  //---- main loop
  for(i=limit; i>=0; i--)
  {
    //---- Calculate the current weekly trend
    EMA21=iMA(NULL,0,21,0,MODE_EMA,PRICE_MEDIAN,i);
    SMA5 =iMA(NULL,0,5,0,MODE_SMA,PRICE_MEDIAN,i);

    //---- Calculate the previous weekly trend
    EMA21Prev=iMA(NULL,0,21,0,MODE_EMA,PRICE_MEDIAN,i+1);
    SMA5Prev =iMA(NULL,0,5,0,MODE_SMA,PRICE_MEDIAN,i+1);


    // Calculate the difference of the MAs
    ExtMapBuffer1[i] = SMA5-EMA21;

    // Calculate the difference of the MAs
    if (((SMA5-EMA21) - (SMA5Prev-EMA21Prev)) > 0.0 )
    {
      ExtMapBuffer2[i] = (SMA5-EMA21) - (SMA5Prev-EMA21Prev);
      ExtMapBuffer3[i] = 0.0;
      Direction = "UP";
    }

    if (((SMA5-EMA21) - (SMA5Prev-EMA21Prev)) < 0.0 )
    {
      ExtMapBuffer2[i] = 0.0;
      ExtMapBuffer3[i] = (SMA5-EMA21) - (SMA5Prev-EMA21Prev);
      Direction = "DOWN";
    }
    // Calculate the start of the week and publish the value in a global variable
    // Publish this with the previous Sunday as the index
    ValueIndex = TimeToStr(Time[i]-TimeDayOfWeek(Time[i]),TIME_DATE);
    KeyValue = Symbol() + "-ThisWeekDirection-" + ValueIndex;
    if (! GlobalVariableCheck(KeyValue))
    GlobalVariableSet(KeyValue, ((SMA5-EMA21) - (SMA5Prev-EMA21Prev)));
    Print("Key: " + KeyValue + " = " + DoubleToStr(((SMA5-EMA21) - (SMA5Prev-EMA21Prev)),4));

    customMethod(SMA5, EMA21, i, Direction );

  }

   Comment("Line = SMA5-EMA21","\n","Histogram = Now - Previous");

   return(0);
  }

void customMethod(double SMA5, double EMA21, int index, string Direction)
{
   double difference = SMA5-EMA21;
   if (Direction == "DOWN")
   {
      ExtMapBuffer4[index] = EMPTY_VALUE;
      ExtMapBuffer5[index] = difference;
   }
   if (Direction == "UP")
   {
      ExtMapBuffer4[index] = difference;
      ExtMapBuffer5[index] = EMPTY_VALUE;
   }
   //EMPTY_VALUE
}
//+------------------------------------------------------------------+
Comments