i-DRProjections_v[1][1].0.1_v1
Download script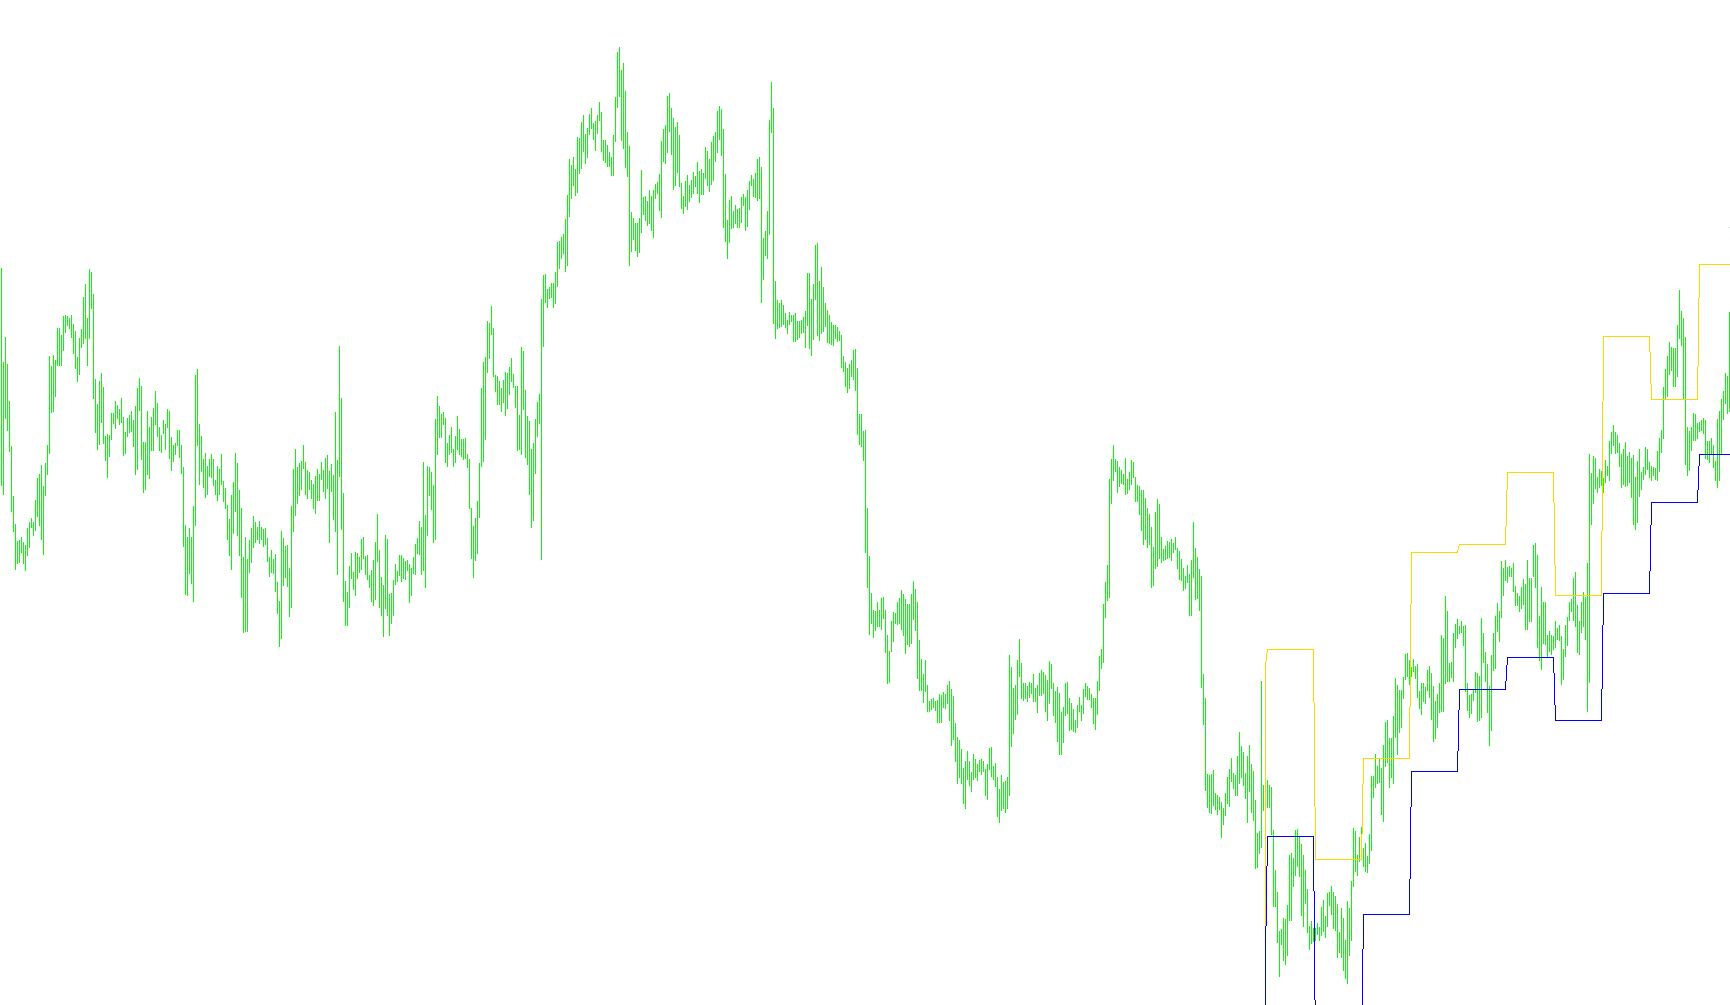
The i-DRProjections indicator is a technical analysis tool designed to help traders visualize and forecast potential price movements based on the concept of "Daily Range." By analyzing historical daily price behavior, the script identifies patterns that can suggest where the market might move next.
Core Logic and Functionality
The primary objective of this script is to calculate and project the expected range of price action for a given period. It achieves this through the following logical steps:
1. Historical Data Analysis The tool looks back at a specific number of previous days (defined by the user) to establish a baseline for market volatility and movement. It examines key data points from these past days, including:
- The opening price
- The highest price reached
- The lowest price reached
- The closing price
2. Calculation of the "Pivot" Point For each historical day, the script determines a central balance point (a weighted average). The logic varies slightly depending on how the day ended relative to how it started:
- If the price closed lower than it opened, the calculation leans more heavily toward the lower end of the day's range.
- If the price closed higher than it opened, it leans toward the upper end.
- If the price remained unchanged, it takes an equal average of the range extremes.
3. Range Projection Once the historical balance points are established, the indicator identifies the "Daily Range." It then applies this mathematical logic to the current market data. By comparing today's opening and closing prices against the historical averages, it calculates where the price is likely to gravitate.
4. Visual Forecasting ("Show Tomorrow") One of the most distinct features of this script is its ability to project potential price boundaries for the upcoming trading session. If enabled, the tool draws two horizontal trend lines on your chart:
- Upper Projection: Indicates a potential ceiling for the price.
- Lower Projection: Indicates a potential floor for the price.
These projections act as visual guides, helping traders identify "zones of interest." Instead of just looking at where the price was, these lines provide a mathematical estimate of where the price could go based on established historical trends and current daily sentiment.
Key User Benefits
- Trend Awareness: Helps traders see if the current daily range is expanding or contracting compared to previous days.
- Target Identification: Provides clear visual markers for potential support and resistance levels for the next day.
- Objective Analysis: Replaces "gut feeling" with a calculated projection based on historical price mechanics, specifically following the principles of Thomas DeMark's trading concepts.
/*-----------------------------+
|			       |
| Shared by www.Aptrafx.com    |
|			       |
+------------------------------*/

//+------------------------------------------------------------------+
//|                                              i-DRProjections.mq4 |
//|                                           Êèì Èãîðü Â. aka KimIV |
//|                                              http://www.kimiv.ru |
//|   27.08.2005 v.0.0 ïî ïðîñüáå $anto$'à                           |
//| Èíäèêàòîð Daily Range Projections                                |
//| Ïðîãíîçèðîâàíèå äíåâíûõ äèàïàçîíîâ öåí                           |
//| Àâòîð èäåè Òîìàñ Äåìàðê                                          |
//|   29.08.2005 v.0.1 Äîðàáîòêà Aleks78                             |
//+------------------------------------------------------------------+
#property copyright "Êèì Èãîðü Â. aka KimIV"
#property link      "http://www.kimiv.ru"

#property indicator_chart_window
#property indicator_buffers 2
#property indicator_color1 LightBlue
#property indicator_color2 LightSalmon

//------- Âíåøíèå ïàðàìåòðû ------------------------------------------
extern int  NumberOfDay  = 10;   // Êîëè÷åñòâî äíåé
extern bool ShowTomorrow = True; // Ïîêàçûâàòü çàâòðà

//------- Áóôåðû èíäèêàòîðà ------------------------------------------
double MaxDay[];
double MinDay[];

//+------------------------------------------------------------------+
//| Custom indicator initialization function                         |
//+------------------------------------------------------------------+
void init() {
  if (ShowTomorrow) {
    ObjectCreate("LineHi", OBJ_TREND, 0, 0,0, 0,0);
    ObjectCreate("LineLo", OBJ_TREND, 0, 0,0, 0,0);
  }

  SetIndexBuffer(0, MaxDay);
  SetIndexStyle (0, DRAW_LINE, STYLE_SOLID, 1);
  SetIndexBuffer(1, MinDay);
  SetIndexStyle (1, DRAW_LINE, STYLE_SOLID, 1);
  Comment("");
}

//+------------------------------------------------------------------+
//| Custor indicator deinitialization function                       |
//+------------------------------------------------------------------+
void deinit() {
  ObjectDelete("LineHi");
  ObjectDelete("LineLo");
  Comment("");
}

//+------------------------------------------------------------------+
//| Custom indicator iteration function                              |
//+------------------------------------------------------------------+
int start() {
  double po, ph, pl, pc, x;
  double MaxDay1, MinDay1, OpenDay1, CloseDay1; //+++
  int    currDay, i=0, j=0;

  if (Period()>240) {
    Comment("Èíäèêàòîð i-DRProjections íå ïîääåðæèâàåò ÒÔ áîëåå Í4 !");
    return;
  }

  while (i<=NumberOfDay) {
    if (currDay!=TimeDay(Time[j])) {
      po = iOpen (NULL, 1440, i+1);
      ph = iHigh (NULL, 1440, i+1);
      pl = iLow  (NULL, 1440, i+1);
      pc = iClose(NULL, 1440, i+1);
      if (pc<po) x = (ph + pl + pc + pl) / 2;
      if (pc>po) x = (ph + pl + pc + ph) / 2;
      if (pc==po) x = (ph + pl + pc + pc) / 2;
      i++;
    }
    currDay = TimeDay(Time[j]);
    MaxDay[j] = x - pl;
    MinDay[j] = x - ph;
    j++;
  }

  //++++++++++++++++++++++++++++++++++++++++++++++++
  if (ShowTomorrow) {
    MaxDay1   = MarketInfo(Symbol(),MODE_HIGH);
    MinDay1   = MarketInfo(Symbol(),MODE_LOW);
    OpenDay1  = iOpen (NULL, 1440, 0);
    CloseDay1 = Bid;

    if (CloseDay1<OpenDay1) x = (MaxDay1 + MinDay1 + CloseDay1 + MinDay1) / 2;
    if (CloseDay1>OpenDay1) x = (MaxDay1 + MinDay1 + CloseDay1 + MaxDay1) / 2;
    if (CloseDay1==OpenDay1) x = (MaxDay1 + MinDay1 + CloseDay1 + CloseDay1) / 2;

    ObjectSet("LineHi",OBJPROP_TIME1, Time[1]);
    ObjectSet("LineLo",OBJPROP_TIME1, Time[1]);
    ObjectSet("LineHi",OBJPROP_PRICE1, x - MinDay1);
    ObjectSet("LineLo",OBJPROP_PRICE1, x - MaxDay1);
    ObjectSet("LineHi",OBJPROP_TIME2, CurTime());
    ObjectSet("LineLo",OBJPROP_TIME2, CurTime());
    ObjectSet("LineHi",OBJPROP_PRICE2, x - MinDay1);
    ObjectSet("LineLo",OBJPROP_PRICE2, x - MaxDay1);
    ObjectSet("LineHi",OBJPROP_COLOR, indicator_color1);
    ObjectSet("LineLo",OBJPROP_COLOR, indicator_color2);
    ObjectSet("LineHi",OBJPROP_RAY, True);
    ObjectSet("LineLo",OBJPROP_RAY, True);
    ObjectSet("LineHi",OBJPROP_STYLE, STYLE_DOT);
    ObjectSet("LineLo",OBJPROP_STYLE, STYLE_DOT);
  }
  //++++++++++++++++++++++++++++++++++++++++++++++++
}
//+------------------------------------------------------------------+
Comments