i Trend
Download script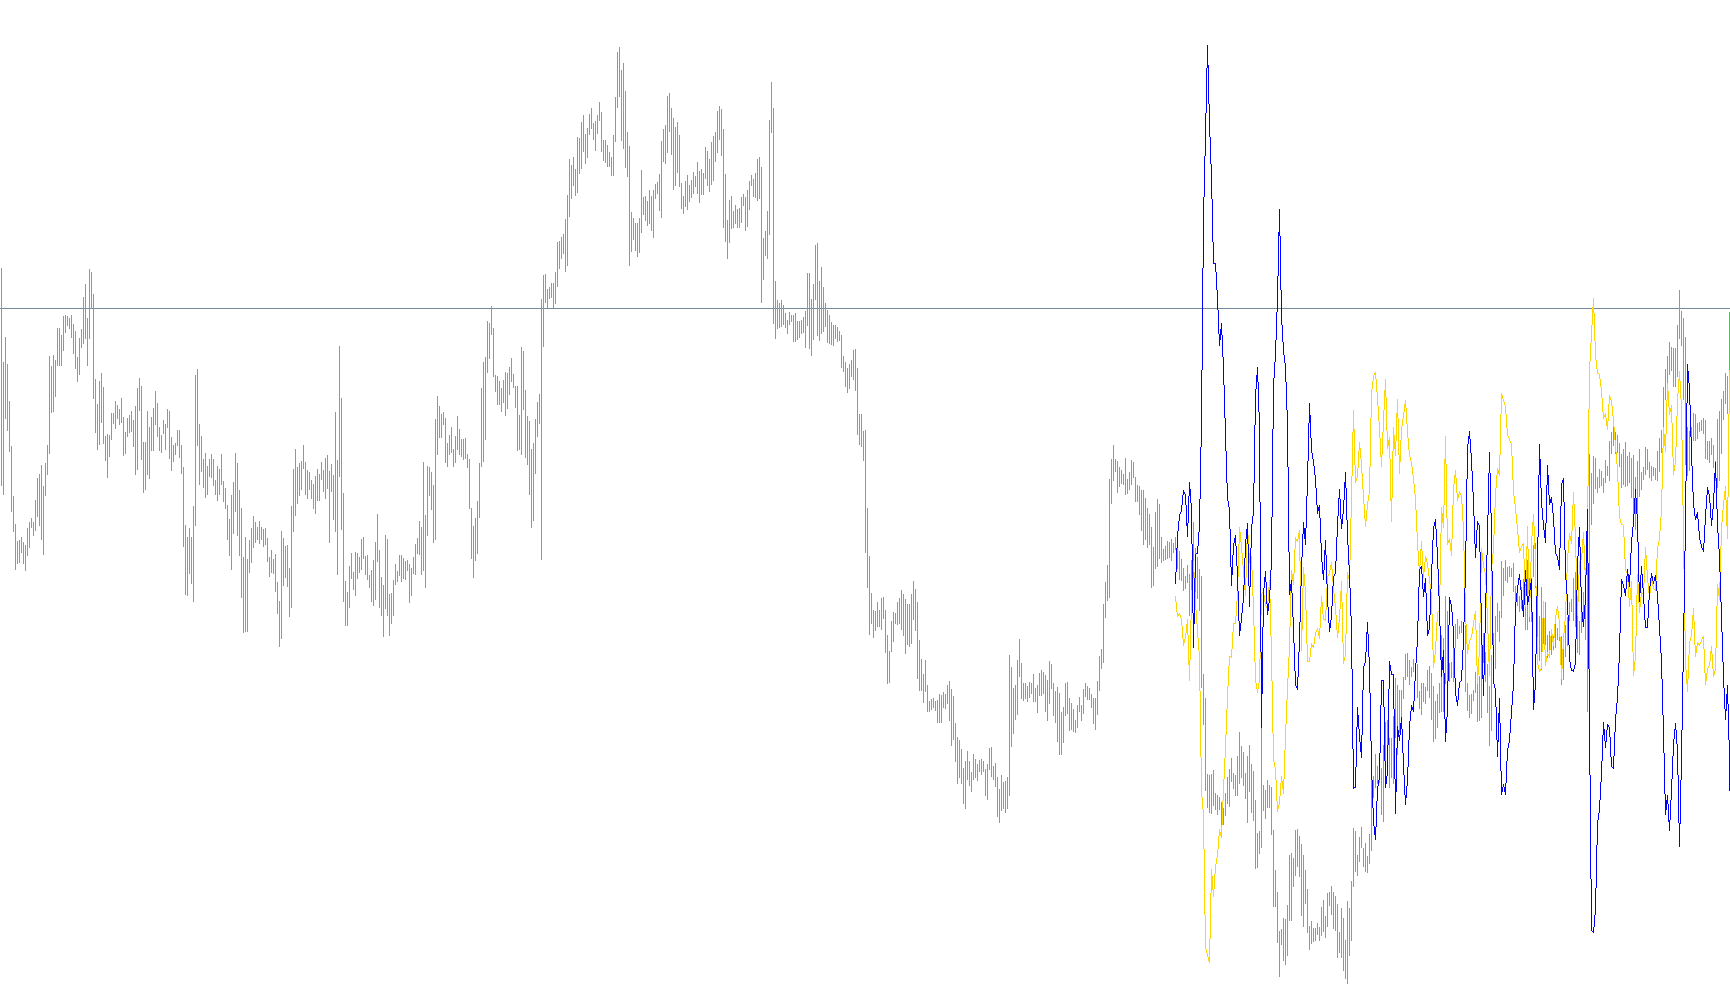
This tool is designed to help traders visualize and interpret market trends by calculating and displaying specific price movements in a dedicated window separate from the main chart. It functions by processing historical price data to identify momentum and directional bias.
Core Logic and Functionality
The script operates based on two primary calculations that are plotted as visual lines:
1. Trend Band Analysis The tool monitors price action relative to specific "Bands." By looking at a defined number of past candles (the Period), the script identifies where the price currently sits in relation to its recent range. It calculates the difference between the current market price and these bands to determine whether the asset is overextended, consolidating, or following a clear trend. Depending on your settings, you can choose to measure this against the main trend, the high boundary, or the low boundary of the price action.
2. Power Momentum Tracking The script also incorporates a "Power" calculation. This looks at the strength behind the current price movement by evaluating "Bullish" and "Bearish" power over a specific timeframe. It essentially weighs how much force is behind the upward move versus the downward move. By combining these forces, the indicator provides a perspective on whether the current trend has significant momentum or if the market is losing steam.
Customization Options
To tailor the logic to different trading styles, the script allows for several adjustable parameters:
- Price Reference: You can decide which specific price point the logic should focus on (such as the Opening, Closing, High, Low, or various weighted averages).
- Sensitivity Settings: Users can adjust the "Bands Period" and "Deviation" to make the indicator more sensitive to small fluctuations or more focused on long-term, significant moves.
- Time Horizons: The tool allows for different periods for trend analysis versus power momentum, enabling traders to see how short-term energy affects long-term trends.
Summary of Use
In simple terms, this script takes raw market data and distills it into two visual signals: one that shows you the relative position of the price compared to its recent "boundaries," and another that highlights the underlying strength (or weakness) of the current price action. This helps traders distinguish between a strong, healthy trend and a weak move that may be prone to reversal.
//+------------------------------------------------------------------+
//|                                                       iTrend.mq4 |
//|                      Copyright © 2004, MetaQuotes Software Corp. |
//|                                        http://www.metaquotes.net |
//+------------------------------------------------------------------+
#property copyright "Copyright © 2004, MetaQuotes Software Corp."
#property link      "http://www.metaquotes.net"

#property indicator_separate_window
#property indicator_buffers 2
#property indicator_color1 LimeGreen
#property indicator_color2 Red
//---- input parameters
extern int Bands_Mode_0_2=0;  // =0-2 MODE_MAIN, MODE_LOW, MODE_HIGH
extern int Power_Price_0_6=0; // =0-6 PRICE_CLOSE,PRICE_OPEN,PRICE_HIGH,PRICE_LOW,PRICE_MEDIAN,PRICE_TYPICAL,PRICE_WEIGHTED
extern int Price_Type_0_3=0;  // =0-3 PRICE_CLOSE,PRICE_OPEN,PRICE_HIGH,PRICE_LOW
extern int Bands_Period=20;
extern int Bands_Deviation=2;
extern int Power_Period=13;
extern int CountBars=300;
//---- buffers
double value[];
double value2[];
//+------------------------------------------------------------------+
//| Custom indicator initialization function                         |
//+------------------------------------------------------------------+
int init()
  {
//   string short_name;
//---- indicator line
   IndicatorBuffers(2);
   SetIndexStyle(0,DRAW_LINE);
   SetIndexStyle(1,DRAW_LINE);
   SetIndexBuffer(0,value);
   SetIndexBuffer(1,value2);
//----

//----
   return(0);
  }
//+------------------------------------------------------------------+
//| Trend                                                         |
//+------------------------------------------------------------------+
int start()
  {
   SetIndexDrawBegin(0,Bars-CountBars+Bands_Period+1);
   SetIndexDrawBegin(1,Bars-CountBars+Bands_Period+1);
   int i,CurrentBar,Bands_Mode,counted_bars=IndicatorCounted();
   double Power_Price,CurrentPrice;
//----
   if(Bars<=Bands_Period) return(0);
//---- initial zero
   if(counted_bars<Bands_Period)
   {
      for(i=1;i<=Bands_Period;i++) value[Bars-i]=0.0;
      for(i=1;i<=Bands_Period;i++) value2[Bars-i]=0.0;
   }
//----
   i=CountBars-Bands_Period-1;
//   if(counted_bars>=Bands_Period) i=Bars-counted_bars-1;


if (Bands_Mode_0_2==1) Bands_Mode=MODE_LOW;
if (Bands_Mode_0_2==2) Bands_Mode=MODE_HIGH;
if (Bands_Mode_0_2==0) Bands_Mode=MODE_MAIN;

if (Power_Price_0_6==1) Power_Price=PRICE_OPEN;
if (Power_Price_0_6==2) Power_Price=PRICE_HIGH;
if (Power_Price_0_6==3) Power_Price=PRICE_LOW;
if (Power_Price_0_6==4) Power_Price=PRICE_MEDIAN;
if (Power_Price_0_6==5) Power_Price=PRICE_TYPICAL;
if (Power_Price_0_6==6) Power_Price=PRICE_WEIGHTED;
if (Power_Price_0_6==6) Power_Price=PRICE_CLOSE;

for (i=CountBars-1; i>=0; i--)
{
  if (Price_Type_0_3==1) CurrentPrice=Open[i];

  if (Price_Type_0_3==2) CurrentPrice=High[i];

  if (Price_Type_0_3==3) CurrentPrice=Low[i];
  if (Price_Type_0_3==0) CurrentPrice=Close[i];

  value[i]=CurrentPrice-iBands(NULL,0,Bands_Period,Bands_Deviation,0,Bands_Mode,Power_Price,i);
  value2[i]=-(iBearsPower(NULL,0,Power_Period,Power_Price,i)+iBullsPower(NULL,0,Power_Period,Power_Price,i));

}


   return(0);
  }
//+------------------------------------------------------------------+
Comments