i-DayRange
Download script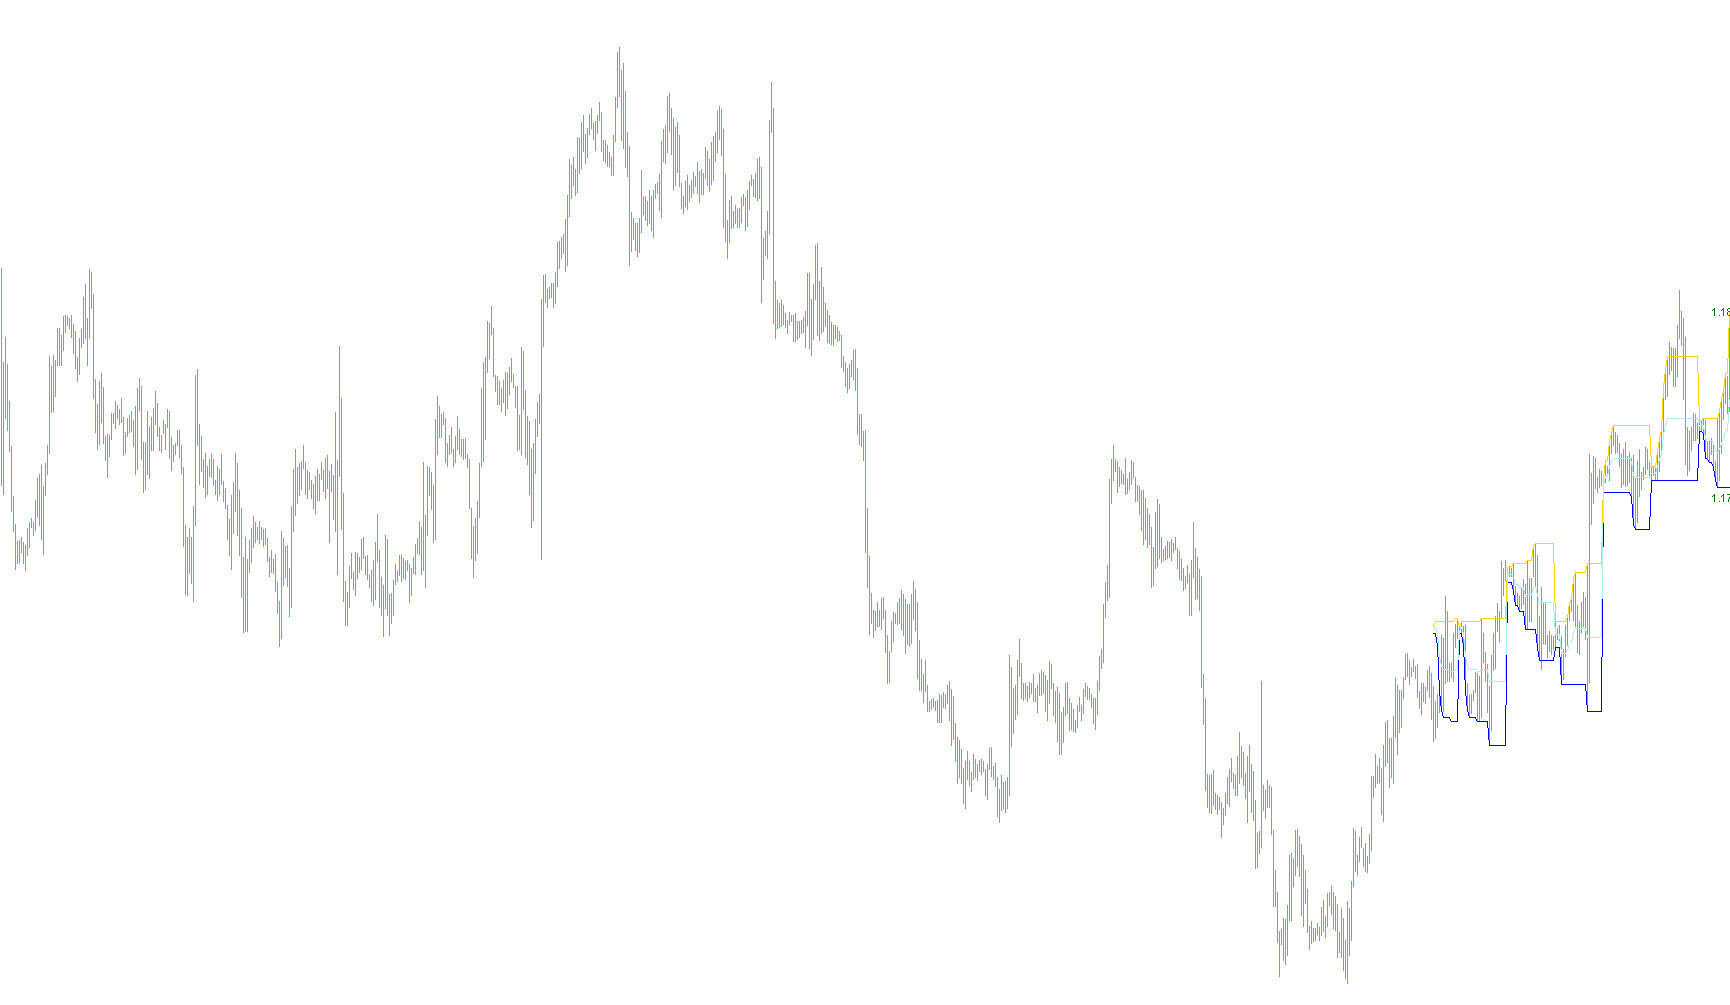
The i-DayRange tool is designed to provide traders with a clear visual representation of the price boundaries established during a specific trading day. It identifies and tracks the "highs" and "lows" of the market, helping users understand the overall volatility and range for a set number of days.
Core Functionality
The logic operates by scanning through historical price data to identify the daily extremes. It automatically detects the highest and lowest prices reached within a day and maps them onto your chart as distinct channels.
Key features of its logic include:
- Daily Range Tracking: The script looks back over a user-defined number of days to establish the boundaries of price movement.
- Dynamic Updates: As new price data arrives during the current trading day, the indicator updates these boundaries in real-time. If the price breaks above the previous daily high or below the previous daily low, the lines adjust accordingly.
- Range Limitations: To prevent extreme outliers from skewing the visual analysis, the script can be configured with a maximum range limit. This ensures that the displayed channels remain relevant to standard market behavior.
- Average Calculation: In addition to the upper and lower boundaries, the logic calculates a "middle" or average line. This represents the mathematical midpoint between the high and low for the day, offering a balanced reference point for price action.
Visual Enhancements
To make the data more actionable for a trader, the script includes several visual aids:
- Line Continuity: It features an option to project these price levels forward toward the end of the current day, ensuring the lines remain visible and continuous across the chart.
- Price Labels: The tool can automatically place text labels on the chart that display the exact numerical value of the daily high and low. This allows for quick identification of key support and resistance figures without having to hover over the lines.
- Real-time Statistics: A dynamic comment is provided on the chart screen, calculating the total range in "points," giving you a live measurement of the distance between the current day's highest and lowest prices.
Summary for the User
Essentially, this script simplifies market analysis by drawing a "box" around the day's price action. It tells you where the market started, how far it has pushed in both directions, and where the center point lies, providing a consistent framework to help you gauge daily volatility at a glance.
//+------------------------------------------------------------------+
//|                                                   i-DayRange.mq4 |
//|                                           Êèì Èãîðü Â. aka KimIV |
//|                                              http://www.kimiv.ru |
//|                                                                  |
//|  17.11.2005  Èíäèêàòîð äíåâíîãî äèàïàçîíà                        |
//|  09.10.2006  Ïî ïðîñüáå CW äîáàâèë ïàðàìåòð MaxRange, êîòîðûé    |
//|              îãðàíè÷èâàåò äèàïàçîí èçìåíåíèÿ èíäèêàòîðà.         |
//|  28.03.2007  Ïî ïðîñüáå avtotorg@list.ru äîáàâèë ïðîäîëæåíèå     |
//|              ëèíèé äî êîíöà äíÿ è öåíîâûå óðîâíè.                |
//+------------------------------------------------------------------+
#property indicator_chart_window
#property indicator_buffers 3
#property indicator_color1 SteelBlue
#property indicator_style1 1
#property indicator_width1 2
#property indicator_color2 SteelBlue
#property indicator_style2 1
#property indicator_width2 2
#property indicator_color3 LightSlateGray
#property indicator_style3 0
#property indicator_width3 1

//------- Âíåøíèå ïàðàìåòðû èíäèêàòîðà -------------------------------
extern int   NumberOfDays = 5;      // Êîëè÷åñòâî äíåé (0-âñå)
extern int   MaxRange     = 300;    // Ìàêñèìàëüíûé äèàïàçîí
extern bool  ShowContinue = True;   // Ïîêàçûâàòü ïðîäîëæåíèå ëèíèé
extern bool  ShowPrice    = True;   // Ïîêàçûâàòü öåíîâûå óðîâíè
extern color clFont       = Green;  // Öâåò øðèôòà
extern int   SizeFont     = 8;      // Ðàçìåð øðèôòà
extern int   OffSet       = 10;     // Ñìåùåíèå

double shifthigh[];
double shiftlow[];
double shiftaver[];

//+------------------------------------------------------------------+
//| Custom indicator initialization function                         |
//+------------------------------------------------------------------+
void init() {
  SetIndexBuffer   (0, shifthigh);
  SetIndexDrawBegin(0, 0);
  SetIndexLabel    (0, "Up Channel");
  SetIndexStyle    (0, DRAW_LINE);

  SetIndexBuffer   (1, shiftlow);
  SetIndexDrawBegin(1, 0);
  SetIndexLabel    (1, "Down Channel");
  SetIndexStyle    (1, DRAW_LINE);

  SetIndexBuffer   (2, shiftaver);
  SetIndexDrawBegin(2, 0);
  SetIndexLabel    (2, "Average Channel");
  SetIndexStyle    (2, DRAW_LINE, 0,1);
}

//+------------------------------------------------------------------+
//| Custor indicator deinitialization function                       |
//+------------------------------------------------------------------+
void deinit() {
  ObjectDelete("UpPrice");
  ObjectDelete("DnPrice");
  Comment("");
}

//+------------------------------------------------------------------+
//| Custom indicator iteration function                              |
//+------------------------------------------------------------------+
void start() {
  datetime dt=CurTime();
  double   HighLine=0, LowLine=0, AverLine=0;
  int      i, j, kb;

  for (i=NumberBar(); i>=0; i--) {
    if (TimeHour(Time[i])==0 && TimeMinute(Time[i])==0) {
      HighLine=iHigh(Symbol(),0,i);
      LowLine=iLow(Symbol(),0,i);
    } else {
      if (MaxRange<=0 || MaxRange*Point>HighLine-LowLine) {
        if (iHigh(NULL,0,i)>HighLine) HighLine=iHigh(NULL,0,i);
        if (iLow(NULL,0,i)<LowLine) LowLine=iLow(NULL,0,i);
      }
    }
    AverLine=LowLine+(HighLine-LowLine)/2;

    kb=(StrToTime(TimeToStr(Time[0], TIME_DATE)+" 23:59")-Time[0])/Period()/60;
    if (i==0 && ShowContinue) {
      SetIndexShift(0, kb);
      SetIndexShift(1, kb);
      SetIndexShift(2, kb);
      for (j=kb; j>=0; j--) {
        shifthigh[j]=HighLine;
        shiftlow [j]=LowLine;
        shiftaver[j]=AverLine;
      }
    }
    shifthigh[i+kb]=HighLine;
    shiftlow [i+kb]=LowLine;
    shiftaver[i+kb]=AverLine;

    if (i==0 && ShowPrice) {
      DrawPrices(dt, "Price", HighLine, LowLine);
    }
  }
  Comment("Òåêóùèé äíåâíîé äèàïàçîí: "+DoubleToStr((HighLine-LowLine)/Point,0)+" ï.");
}

//+------------------------------------------------------------------+
//| Ïðîðèñîâêà öåíîâûõ ìåòîê íà ãðàôèêå                              |
//| Ïàðàìåòðû:                                                       |
//|   dt - äàòà òîðãîâîãî äíÿ                                        |
//|   no - íàèìåíîâàíèå îáúåêòà                                      |
//|   up - âåðõíèé öåíîâîé óðîâåíü                                   |
//|   dn - íèæíèé öåíîâîé óðîâåíü                                    |
//+------------------------------------------------------------------+
void DrawPrices(datetime dt, string no, double up, double dn) {
  if (ObjectFind("Up"+no)<0) ObjectCreate("Up"+no, OBJ_TEXT, 0, 0,0);
  ObjectSet("Up"+no, OBJPROP_TIME1   , dt);
  ObjectSet("Up"+no, OBJPROP_PRICE1  , up+(OffSet+SizeFont)*Point);
  ObjectSet("Up"+no, OBJPROP_COLOR   , clFont);
  ObjectSet("Up"+no, OBJPROP_FONTSIZE, SizeFont);
  ObjectSetText("Up"+no, DoubleToStr(up, Digits));

  if (ObjectFind("Dn"+no)<0) ObjectCreate("Dn"+no, OBJ_TEXT, 0, 0,0);
  ObjectSet("Dn"+no, OBJPROP_TIME1   , dt);
  ObjectSet("Dn"+no, OBJPROP_PRICE1  , dn-OffSet*Point);
  ObjectSet("Dn"+no, OBJPROP_COLOR   , clFont);
  ObjectSet("Dn"+no, OBJPROP_FONTSIZE, SizeFont);
  ObjectSetText("Dn"+no, DoubleToStr(dn, Digits));
}

//+------------------------------------------------------------------+
//| Âîçâðàùàåò íîìåð áàðà                                            |
//+------------------------------------------------------------------+
int NumberBar() {
  int nd=0, i=0;

  while (nd<NumberOfDays) {
    i++;
    if (TimeHour(Time[i])==0 && TimeMinute(Time[i])==0) nd++;
  }
  return(i);
}
//+------------------------------------------------------------------+
Comments