Hull_Style_ATR_v1
Download script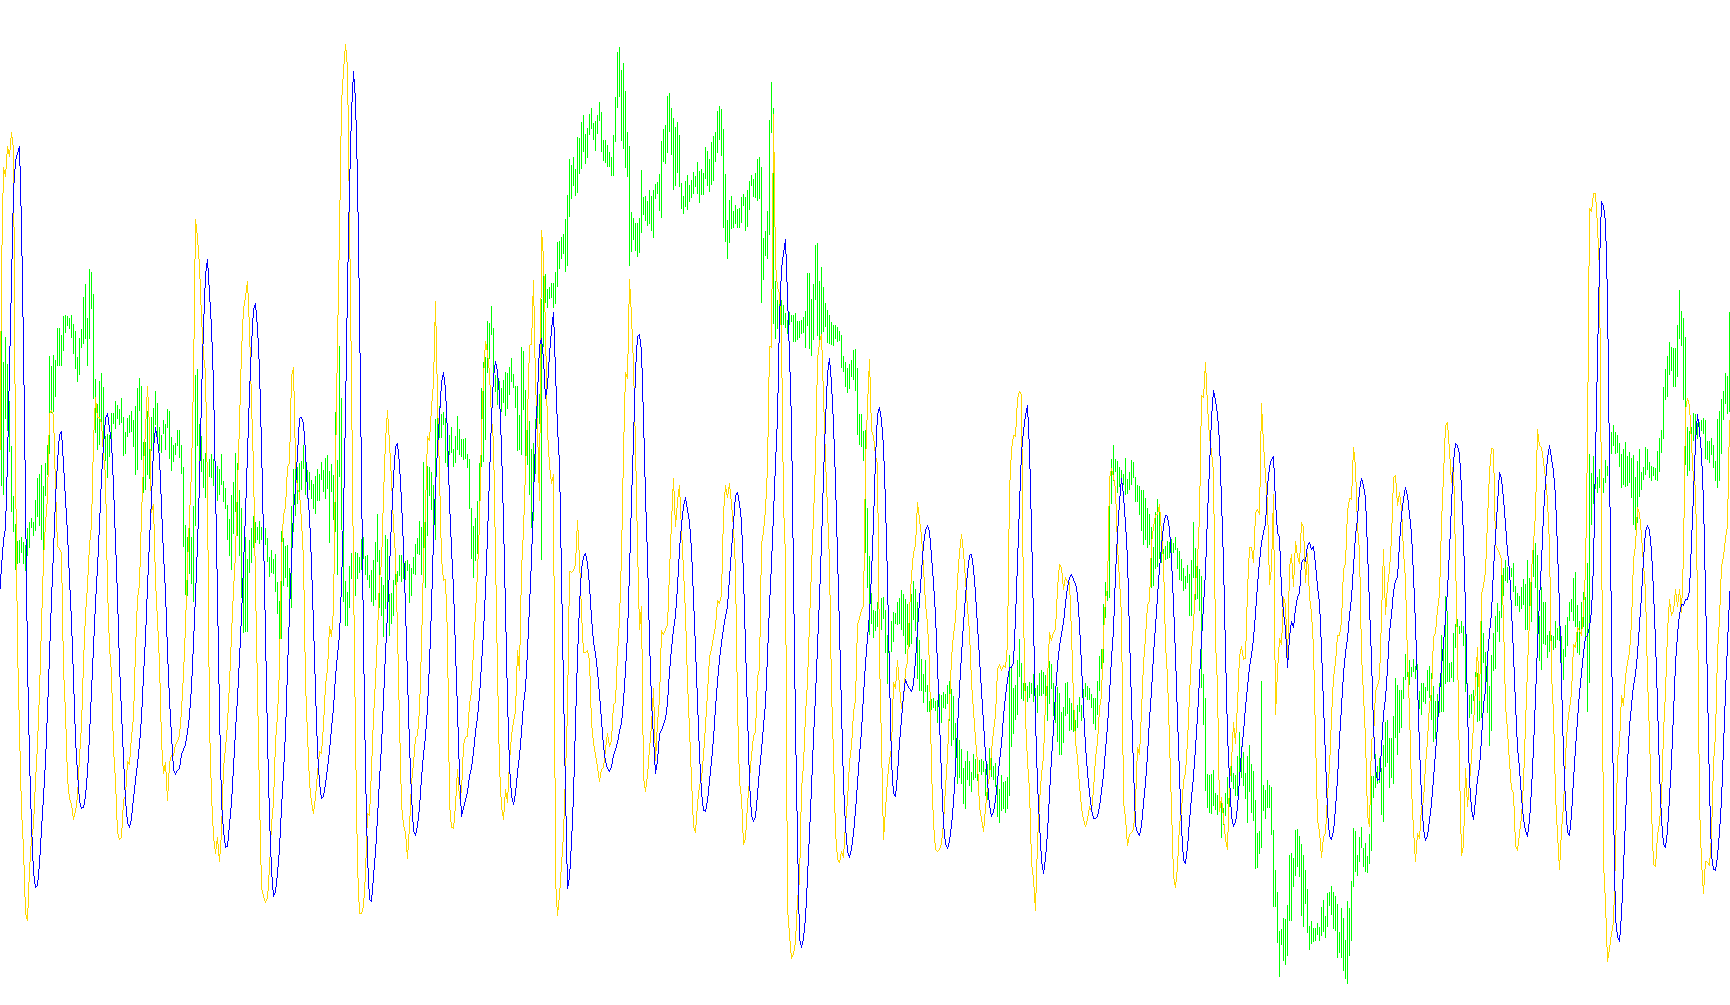
This tool is designed to provide traders with a specialized visual representation of market volatility. Rather than simply showing raw data, it applies a multi-layered mathematical process to "smooth out" the noise of price movements, making it easier to identify underlying trends in market activity.
How the Logic Works
The script processes information through two distinct stages to arrive at its final visual output:
1. The Volatility Foundation (Initial Processing) The tool starts by looking at the Average True Range (ATR), which is a standard measure of how much a price moves on average over a specific timeframe. However, instead of showing this raw value, the script performs a specific calculation: it takes a shorter measurement of volatility, doubles it, and then subtracts a longer measurement of volatility. This specific logic is intended to capture rapid changes in momentum while filtering out insignificant "jitters" in the price.
2. The Smoothing Layer (Final Refinement) Once that initial volatility data is calculated, the script performs a second pass. It takes that resulting data and applies a "Moving Average" calculation to it. This acts like a secondary filter, rounding off sharp peaks and valleys to create a fluid, flowing line. By using a square root calculation to determine the intensity of this smoothing, the tool ensures that the line remains responsive enough to react to real market shifts without being overly erratic.
Key Visual Features
- Dual Line Display: The script tracks two separate data points—the raw processed volatility and the final smoothed version—allowing you to see both the immediate reaction and the long-term trend simultaneously.
- Customizable Sensitivity: Users can adjust the periods for both the volatility measurement and the smoothing calculation, as well as choose different types of moving averages (such as Simple or Exponential) to suit their specific trading style.
Summary for the Trader
Essentially, this script takes the "messy" data of market volatility and puts it through a two-step refinery. The first step identifies the core movement, and the second step smooths that movement into a clear, readable curve. This helps traders distinguish between temporary market noise and significant changes in price behavior.
//+------------------------------------------------------------------+
//|                                               Hull_Style_ATR.mq4 |
//+------------------------------------------------------------------+

//---- indicator settings

#property  indicator_separate_window

#property  indicator_buffers 2

#property  indicator_color1  LightSeaGreen

#property  indicator_color2  Purple

//---- indicator parameters

extern int Atr_Time            =  0;
extern int ATR_Period          = 14;
extern int SignalLine_Period   = 21;
extern int SignalLineShift     =  3;
extern int SignalLineMa_Method =  0; // 0 SMA , 1 EMA , 2 SMMA , 3 LWMA

//---- indicator buffers

double preatrbuffer[];
double finalatrbuffer[];

int    draw_begin0;

//+------------------------------------------------------------------+
//| Custom indicator initialization function                         |
//+------------------------------------------------------------------+

int init()
 {

//---- indicator buffers mapping

//---- drawing settings

  draw_begin0 = ATR_Period+MathFloor(MathSqrt(ATR_Period));

  SetIndexEmptyValue(0,0.0000);
  SetIndexStyle(0,DRAW_LINE,STYLE_SOLID,1);
  SetIndexBuffer(0,preatrbuffer);
  SetIndexLabel(0,"ATR");
  SetIndexDrawBegin(0,draw_begin0);

  SetIndexEmptyValue(1,0.0000);
  SetIndexStyle(1,DRAW_LINE,STYLE_SOLID,1);
  SetIndexBuffer(1,finalatrbuffer);
  SetIndexLabel(1,"ATR");
  SetIndexDrawBegin(1,draw_begin0);


//---- name for DataWindow and indicator subwindow label

  IndicatorShortName("Hull_Style_ATR("+ATR_Period+")");


//---- initialization done
  return(0);
 }

//+------------------------------------------------------------------+
//|                                                                  |
//+------------------------------------------------------------------+

int start()
 {
  int limit,i,shift;
  int counted_bars=IndicatorCounted();

//---- check for possible errors
  if(counted_bars<1)
   {
     for(i=1;i<=draw_begin0;i++) { finalatrbuffer[Bars-i]=0; preatrbuffer[Bars-i]=0; }
   }

//---- last counted bar will be recounted
  if(counted_bars>0) counted_bars--;
  limit=Bars-counted_bars;

//-----------------------------------------------------------------------------------------------------------------

//---- preadxbuffer

  for(i=0; i<limit; i++)
    { preatrbuffer[i] = (iATR(Symbol(), Atr_Time, MathFloor(ATR_Period/2), i)*2) - iATR(Symbol(), Atr_Time, ATR_Period, i); }

//---- finaladxbuffer

  for(i=0; i<limit; i++)
    { finalatrbuffer[i]=iMAOnArray(preatrbuffer,0,MathFloor(MathSqrt(SignalLine_Period)),SignalLineShift,SignalLineMa_Method,i); }

//-----------------------------------------------------------------------------------------------------------------

//---- done
  return(0);
 }
Comments