Full_Bar_w_Spread_Shadow
Download script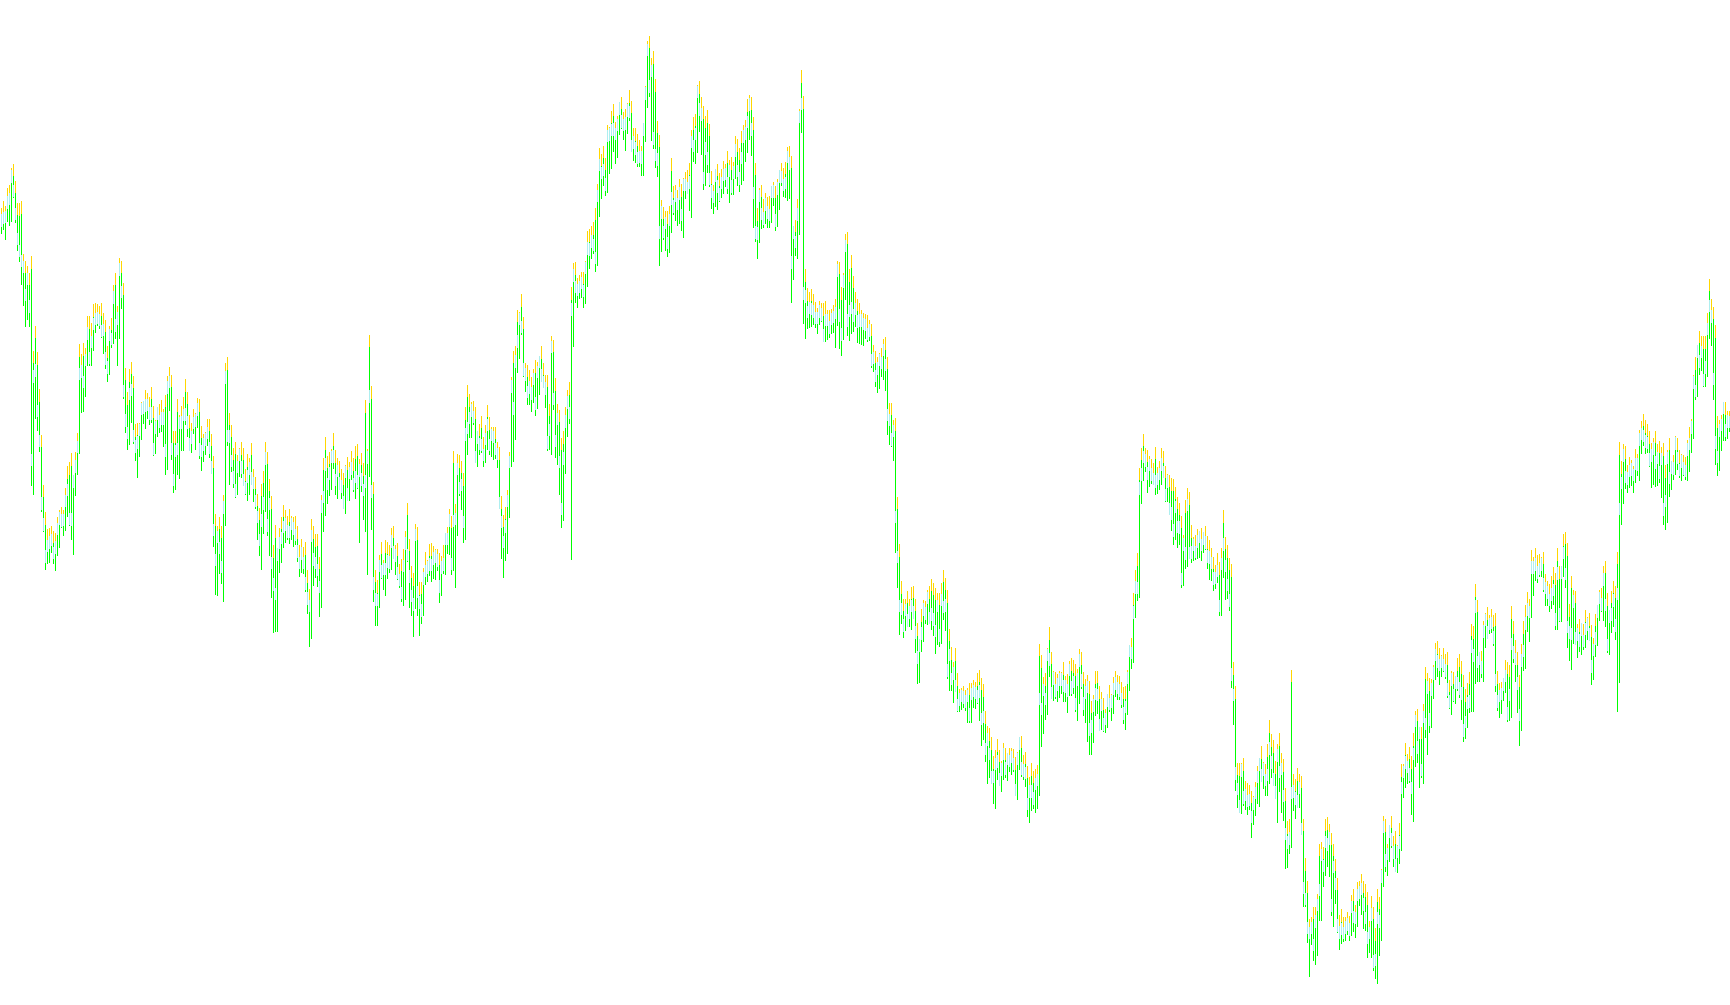
This tool is designed to provide a more comprehensive visual representation of price action on your trading chart by accounting for the "spread"—the difference between the buying and selling price—which is often overlooked in standard charts.
Core Logic Overview
The primary goal of this script is to visualize the "real" boundaries of market movement. In standard trading, charts usually show you the highest and lowest prices reached during a specific time period (bars). However, because there is always a gap between what you can buy at and what you can sell at, this script calculates adjusted price points to give you a clearer picture of where the market actually sits.
How it Works
The logic processes each candle on your chart by performing three main calculations:
- Identifying the Spread: The script constantly monitors the live difference between the "Ask" (buy) and "Bid" (sell) prices.
- Adjusting Highs and Lows: It takes the highest price reached in a bar and adds the spread to it, creating a "Top Plus" value. This helps represent the maximum reachable point for a seller.
- Split Price Calculation: The script determines a "split" point based on the closing price of the candle combined with the current spread.
Visual Representation
The tool then maps these values onto your chart using four distinct visual layers:
- Upper Boundaries: It identifies the highest possible points, choosing between the raw high of the candle and the adjusted "split" price depending on which is higher. This ensures you see the most significant peak reached during that period.
- Lower Boundaries: It captures the base closing price (the "Lsplitprice") to show the foundational level where the price settled.
- Midpoint Tracking: It plots the adjusted split price, providing a visual anchor for where the price balance sat during the candle's duration.
By visualizing these four specific data points simultaneously, the tool allows you to see the full "shadow" of the market movement, providing a more accurate view of liquidity and price boundaries than a standard candle alone can offer.
//+------------------------------------------------------------------+
//|                                     Full_Bar_w_Spread_Shadow.mq4 |
//|                              transport_david , David W Honeywell |
//|                                        transport.david@gmail.com |
//+------------------------------------------------------------------+
#property copyright "transport_david , David W Honeywell"
#property link      "transport.david@gmail.com"

#property indicator_chart_window
#property indicator_buffers 4
#property indicator_color1 Lime
#property indicator_color2 Lime
#property indicator_color3 Coral
#property indicator_color4 Coral
//---- input parameters

//---- buffers

double ExtMapBuffer0[];
double ExtMapBuffer1[];
double ExtMapBuffer2[];
double ExtMapBuffer3[];

//+------------------------------------------------------------------+
//| Custom indicator initialization function                         |
//+------------------------------------------------------------------+
int init()
  {
//---- indicators
   SetIndexStyle(0,DRAW_HISTOGRAM, 0, 1);
   SetIndexBuffer(0, ExtMapBuffer0);
   SetIndexStyle(1,DRAW_HISTOGRAM, 0, 1);
   SetIndexBuffer(1, ExtMapBuffer1);
   SetIndexStyle(2,DRAW_HISTOGRAM, 0, 1);
   SetIndexBuffer(2, ExtMapBuffer2);
   SetIndexStyle(3,DRAW_HISTOGRAM, 0, 1);
   SetIndexBuffer(3, ExtMapBuffer3);
//----
   return(0);
  }
//+------------------------------------------------------------------+
//| Custor indicator deinitialization function                       |
//+------------------------------------------------------------------+
int deinit()
  {
//----

//----
   return(0);
  }
//+------------------------------------------------------------------+
//| Custom indicator iteration function                              |
//+------------------------------------------------------------------+
int start()
 { double spread, Hsplitprice, Lsplitprice, Top, TopPlus;
   int counted_bars=IndicatorCounted();
   if  (counted_bars<0) return(-1);
   if  (counted_bars>0) counted_bars--;
   int i;
//----
   for (i=counted_bars-1; i>=0; i--)
     { spread = (Ask-Bid);
       TopPlus = (High[i]+spread);
       Top = (High[i]);
       Hsplitprice = (Close[i]+spread);
       Lsplitprice = (Close[i]);

       ExtMapBuffer0[i] = TopPlus;
       if (Top <  Hsplitprice) { ExtMapBuffer1[i] = Hsplitprice; }
       if (Top >= Hsplitprice) { ExtMapBuffer1[i] = Top; }
       ExtMapBuffer2[i] = Hsplitprice;
       ExtMapBuffer3[i] = Lsplitprice;
     }
//----
   return(0);
 }
//+------------------------------------------------------------------+
Comments