Fractaluri
Download script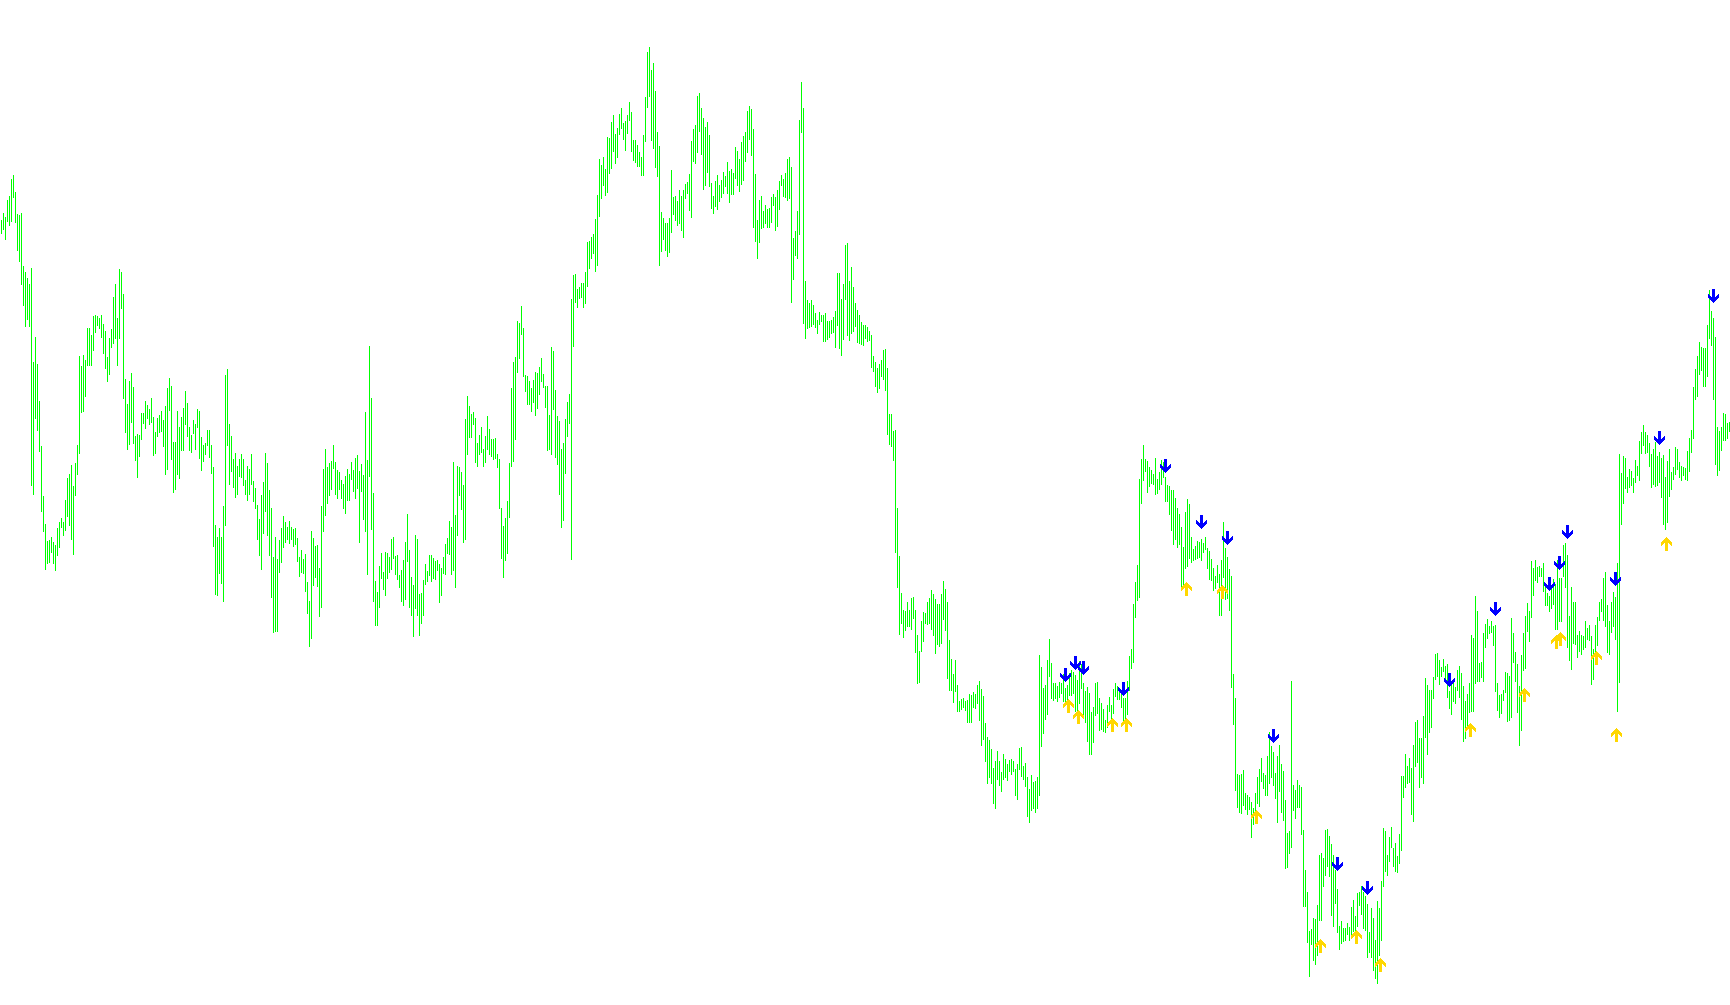
The SilverTrend Signal script is designed to identify clear shifts in market momentum by analyzing historical price action and volatility. Instead of simply reacting to every minor price wiggle, the tool looks for significant "breakouts" relative to recent price ranges to determine whether a trend is moving upward or downward.
How the Logic Works
1. Volatility Measurement The script first calculates the average height of price candles over a specific period. By measuring the difference between the highest and lowest points reached during these candles, it establishes a "standard" range for the market's current volatility. This ensures that the signals remain relevant whether the market is moving slowly or swinging wildly.
2. Dynamic Boundary Calculation The tool identifies the highest high and the lowest low over a set look-back period. Based on a user-defined risk percentage, it then calculates two invisible "threshold" lines:
- An upper boundary (resistance)
- A lower boundary (support)
These boundaries act as the "gatekeepers" for the trend. If the price stays within these bounds, the script remains neutral.
3. Trend Detection and Signal Generation The script constantly monitors the closing price of each candle against these calculated boundaries:
- Bullish Signal: When a candle closes significantly above the upper boundary, the script recognizes a shift to an upward trend. It then places an "Aqua" colored arrow below the candle to signal this transition.
- Bearish Signal: When a candle closes significantly below the lower boundary, the script recognizes a shift to a downward trend. It then places a "Violet" colored arrow above the candle to signal this transition.
4. Trend Consistency The logic includes a memory feature that prevents the script from generating repetitive signals. It only triggers an arrow at the exact moment the trend changes (e.g., moving from down to up). Once a trend is established, it ignores subsequent candles until the price breaks out in the opposite direction again.
Summary for the Trader
This tool helps filter out "market noise" by focusing on structural breaks. It identifies when the price has moved far enough away from its recent average to justify a new trend direction, providing visual markers (arrows) at the precise moment these shifts occur.
//+------------------------------------------------------------------+
//| SilverTrend_Signal.mq4
//| Ramdass - Conversion only
//+------------------------------------------------------------------+
#property copyright "SilverTrend  rewritten by CrazyChart"
#property link      "http://viac.ru/"

#property indicator_chart_window
#property indicator_buffers 2
#property indicator_color1 Aqua
#property indicator_color2 Violet

//---- input parameters
extern int RISK=3;
extern int CountBars=350;
int SSP=9;

//---- buffers
double val1[];
double val2[];

//+------------------------------------------------------------------+
//| Custom indicator initialization function                         |
//+------------------------------------------------------------------+
int init()
  {
   string short_name;
//---- indicator line
   IndicatorBuffers(2);
   SetIndexStyle(0,DRAW_ARROW);
   SetIndexArrow(0,233);
   SetIndexStyle(1,DRAW_ARROW);
   SetIndexArrow(1,234);
   SetIndexBuffer(0,val1);
   SetIndexBuffer(1,val2);
//----
   return(0);
  }
//+------------------------------------------------------------------+
//| SilverTrend_Signal                                               |
//+------------------------------------------------------------------+
int start()
  {
   if (CountBars>=Bars) CountBars=Bars;
   SetIndexDrawBegin(0,Bars-CountBars+SSP);
   SetIndexDrawBegin(1,Bars-CountBars+SSP);
   int i,shift,counted_bars=IndicatorCounted();
   int i1,i2,K;
   double Range,AvgRange,smin,smax,SsMax,SsMin,price;
   bool uptrend,old;
//----

   if(Bars<=SSP+1) return(0);
//---- initial zero
   if(counted_bars<SSP+1)
   {
      for(i=1;i<=SSP;i++) val1[CountBars-i]=0.0;
      for(i=1;i<=SSP;i++) val2[CountBars-i]=0.0;
   }
//----

K=33-RISK;
for (shift = CountBars-SSP; shift>=0; shift--)
{

	Range=0;
	AvgRange=0;
	for (i1=shift; i1<=shift+SSP; i1++)
		{AvgRange=AvgRange+MathAbs(High[i1]-Low[i1]);
		}
	Range=AvgRange/(SSP+1);

SsMax=High[shift]; SsMin=Low[shift];
   for (i2=shift;i2<=shift+SSP-1;i2++)
        {
         price=High[i2];
         if(SsMax<price) SsMax=price;
         price=Low[i2];
         if(SsMin>=price)  SsMin=price;
        }

smin = SsMin+(SsMax-SsMin)*K/100;
smax = SsMax-(SsMax-SsMin)*K/100;
	val1[shift]=0;
	val2[shift]=0;
	if (Close[shift]<smin)
		{
		uptrend = false;
		}
	if (Close[shift]>smax)
		{
		uptrend = true;
		}
   if (uptrend!=old && uptrend==true) {val1[shift]=Low[shift]-Range*0.5;}
   if (uptrend!=old && uptrend==false) {val2[shift]=High[shift]+Range*0.5;}
   old=uptrend;

}
   return(0);
  }
//+------------------------------------------------------------------+
Comments